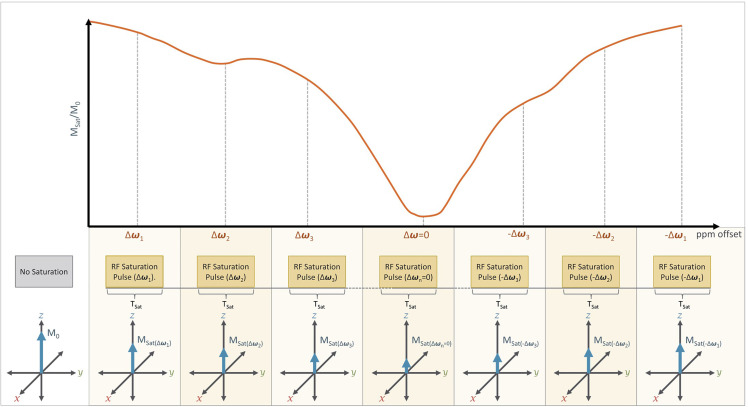
Figure 7.
A typical CEST Imaging experiment: In practice, CEST imaging is performed using a series of RF saturation pulses that are applied at different offset frequencies (±Δω) which are measured relative to the Larmor frequency of free water (ω). Direct water saturation occurs when CEST is performed at the Larmor frequency of free water (i.e. Δω=0), which will result in a significant reduction in net magnetization (Msat) relative to the initial net magnetization (M0). The series of RF pulses are typically applied at and near the expected Larmor frequency of a desired solute proton (Δω1, Δω2, Δω3) and at frequency offsets (-Δω1,-Δω2, -Δω3) from water. The presence of a solute proton with a chemical shift (+Δω= Δωs) would therefore appear as a dip in the CEST spectrum at that chemical shift (+Δωs) relative to its opposite (-Δωs). For example, we can see such a dip in Δω2 relative to -Δω2.

