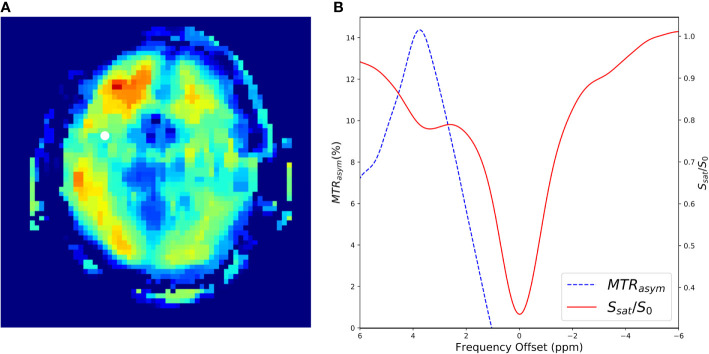
Figure 8.
A CEST experiment collected in a human at 7T using an off-resonance RF pulse of B1 = 1.5 µT and a frequency sweep from −6 to 6 ppm with steps of 0.2 ppm. Data were collected using a 3D gradient echo sequence with a TE = 0.5 ms, TR = 3.8 ms. flip angle = 10, FOV = 22 cm × 22 cm × 15 cm, slice thickness=1.0 cm, matrix size = 64 × 64 × 10, NEX = 3.0. (A) Shows the resulting CESTasym image generated with at Δω at 3.5ppm. The white dot shows a region of interest where the CEST spectrum in (B) was generated. (B) Shows the CEST-spectrum plot in red and the CESTasym spectrum in blue. The peak of the CESTasym is at 3.5ppm corresponding to amide proton transfer (APT).

