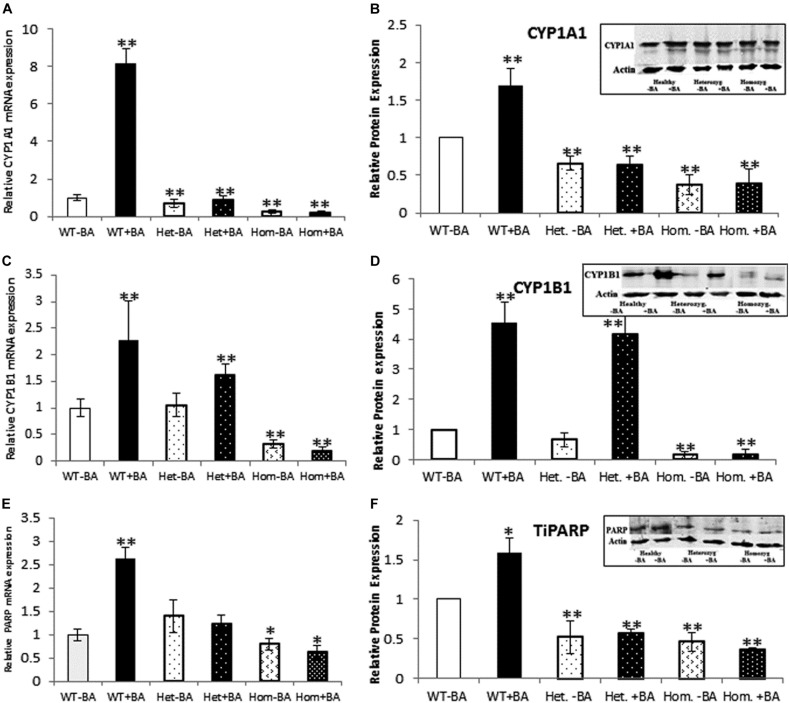
FIGURE 2.
mRNA and protein expression of AHR target genes. CYP1A1 (A,B), CYP1B1 (C,D), and TiPARP (E,F). In all graphs, the columns correspond to lysates of non-induced leukocyte cultures (white columns) or lysates of BA-induced cultures (BA, black columns). (A) Relative CYP1A1 mRNA expression was examined by qRT PCR using GAPDH as an internal control. (B) Relative CYP1A1 protein expression was determined by western blotting with an antibody against CYP1A1. (C) Relative CYP1B1 mRNA expression was examined by qRT PCR with GAPDH as internal control. (D) CYP1B1 protein expression was determined by western blotting with CYP1B1 antibodies. (E) Relative TiPARP mRNA expression was examined by qRT PCR using GAPDH as internal control. (F) TiPARP protein expression was detected with PARP antibodies. The leukocyte culture lysates were run on 10% SDS PAGE, transferred to nitrocellulose and probed with specific antibodies as described in the “Materials and Methods” section. Band densities were normalized to the β-Actin loading control and quantified as a fraction of non-treated WT. Data were obtained separately from either patients or healthy subjects and were averaged. Data are shown as mean ± SD, n = 4 technical replicates for each of three healthy volunteers, two heterozygous patients (Het), and three homozygous patients (Hom). Insets show a representative western blot obtained using a LI-COR Odyssey IR scanner. Upper bands correspond to tested protein and lower bands correspond to β-Actin loading control. A two-tailed t-test analysis of statistical significance was done; p < 0.01* and p < 0.05** refer variances between homozygous patients vs. healthy control samples.

