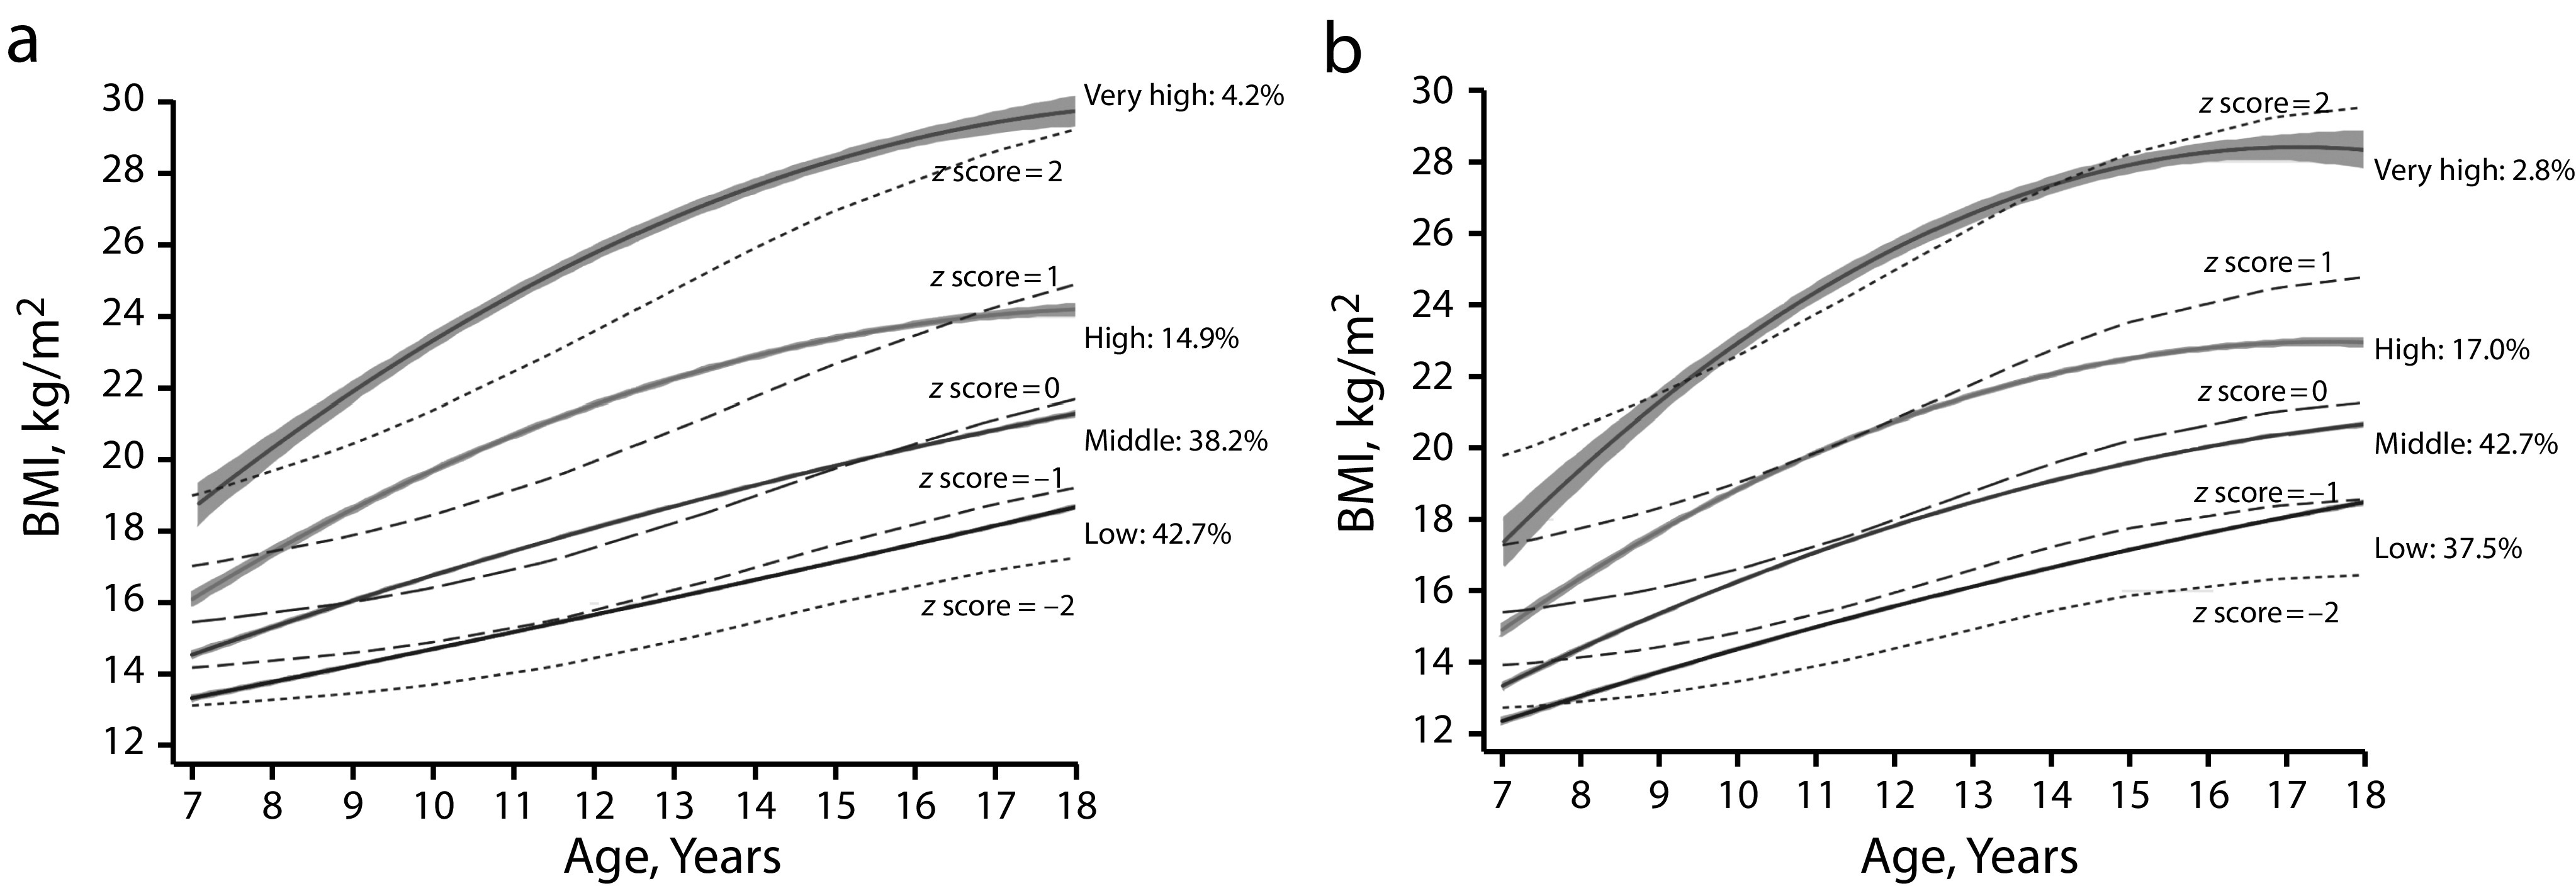
FIGURE 1—

Trajectories of Body Mass Index During Adolescence Compared With the World Health Organization 2007 Growth Reference in Children and Adolescents for (a) Boys and (b) Girls: Guangdong, China, 2006–2016
Note. BMI = body mass index. Solid lines indicate the trajectory groups, while gray shades indicate 95% confidence intervals of each trajectory group. Gray dash lines from bottom to top represent World Health Organization cutoffs for thinness, slim, normal, overweight, and obesity (z score of −2 SD, −1 SD, median, 1 SD, and 2 SD, respectively).15
