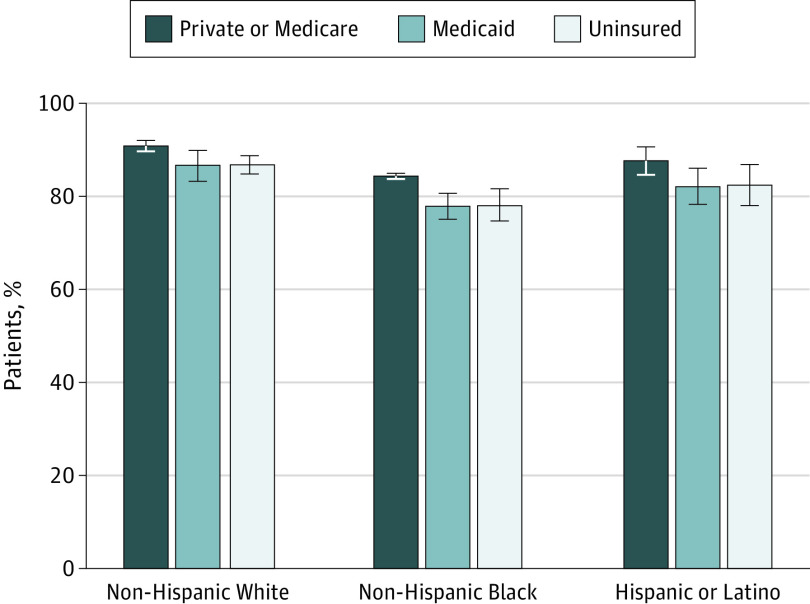
Figure 1. Treatment of High-Risk Prostate Cancer Based on Race/Ethnicity and Insurance Status.
This figure displays the estimated proportion of patients with high-risk prostate cancer who were treated, based on race/ethnicity and insurance status. The values are based on estimated margins from models using a cohort of 13 912 men with complete data adjusting for patient age, prostate-specific antigen level, biopsy Gleason score, marital status, race/ethnicity, insurance status, state-level expansion, and timing of diagnosis (pre-expansion vs postexpansion). Whiskers indicate 95% CIs.

