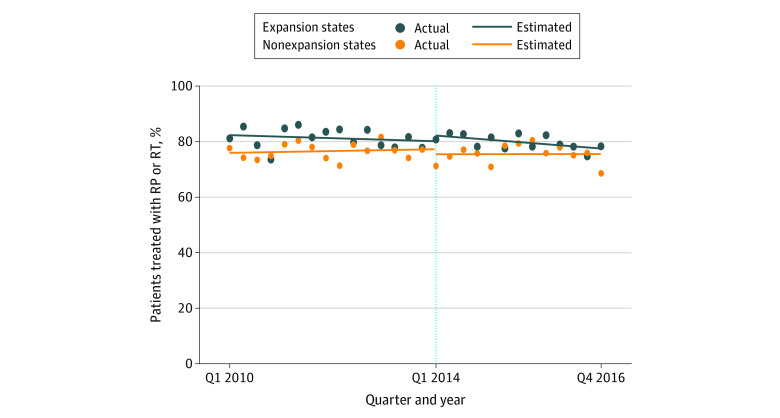
Figure 2. Time Trends in Treatment of Patients With High-Risk Prostate Cancer Based on State-Level Medicaid Expansion.
This figure demonstrates the trends in quarterly proportions of patients with high-risk prostate cancer residing in expansion states (blue dots) and nonexpansion states (orange dots) who underwent treatment with radical prostatectomy (RP) or radiation therapy (RT). The vertical dotted line at Q1 2014 indicates when Medicaid expansion was approved in expansion states.

