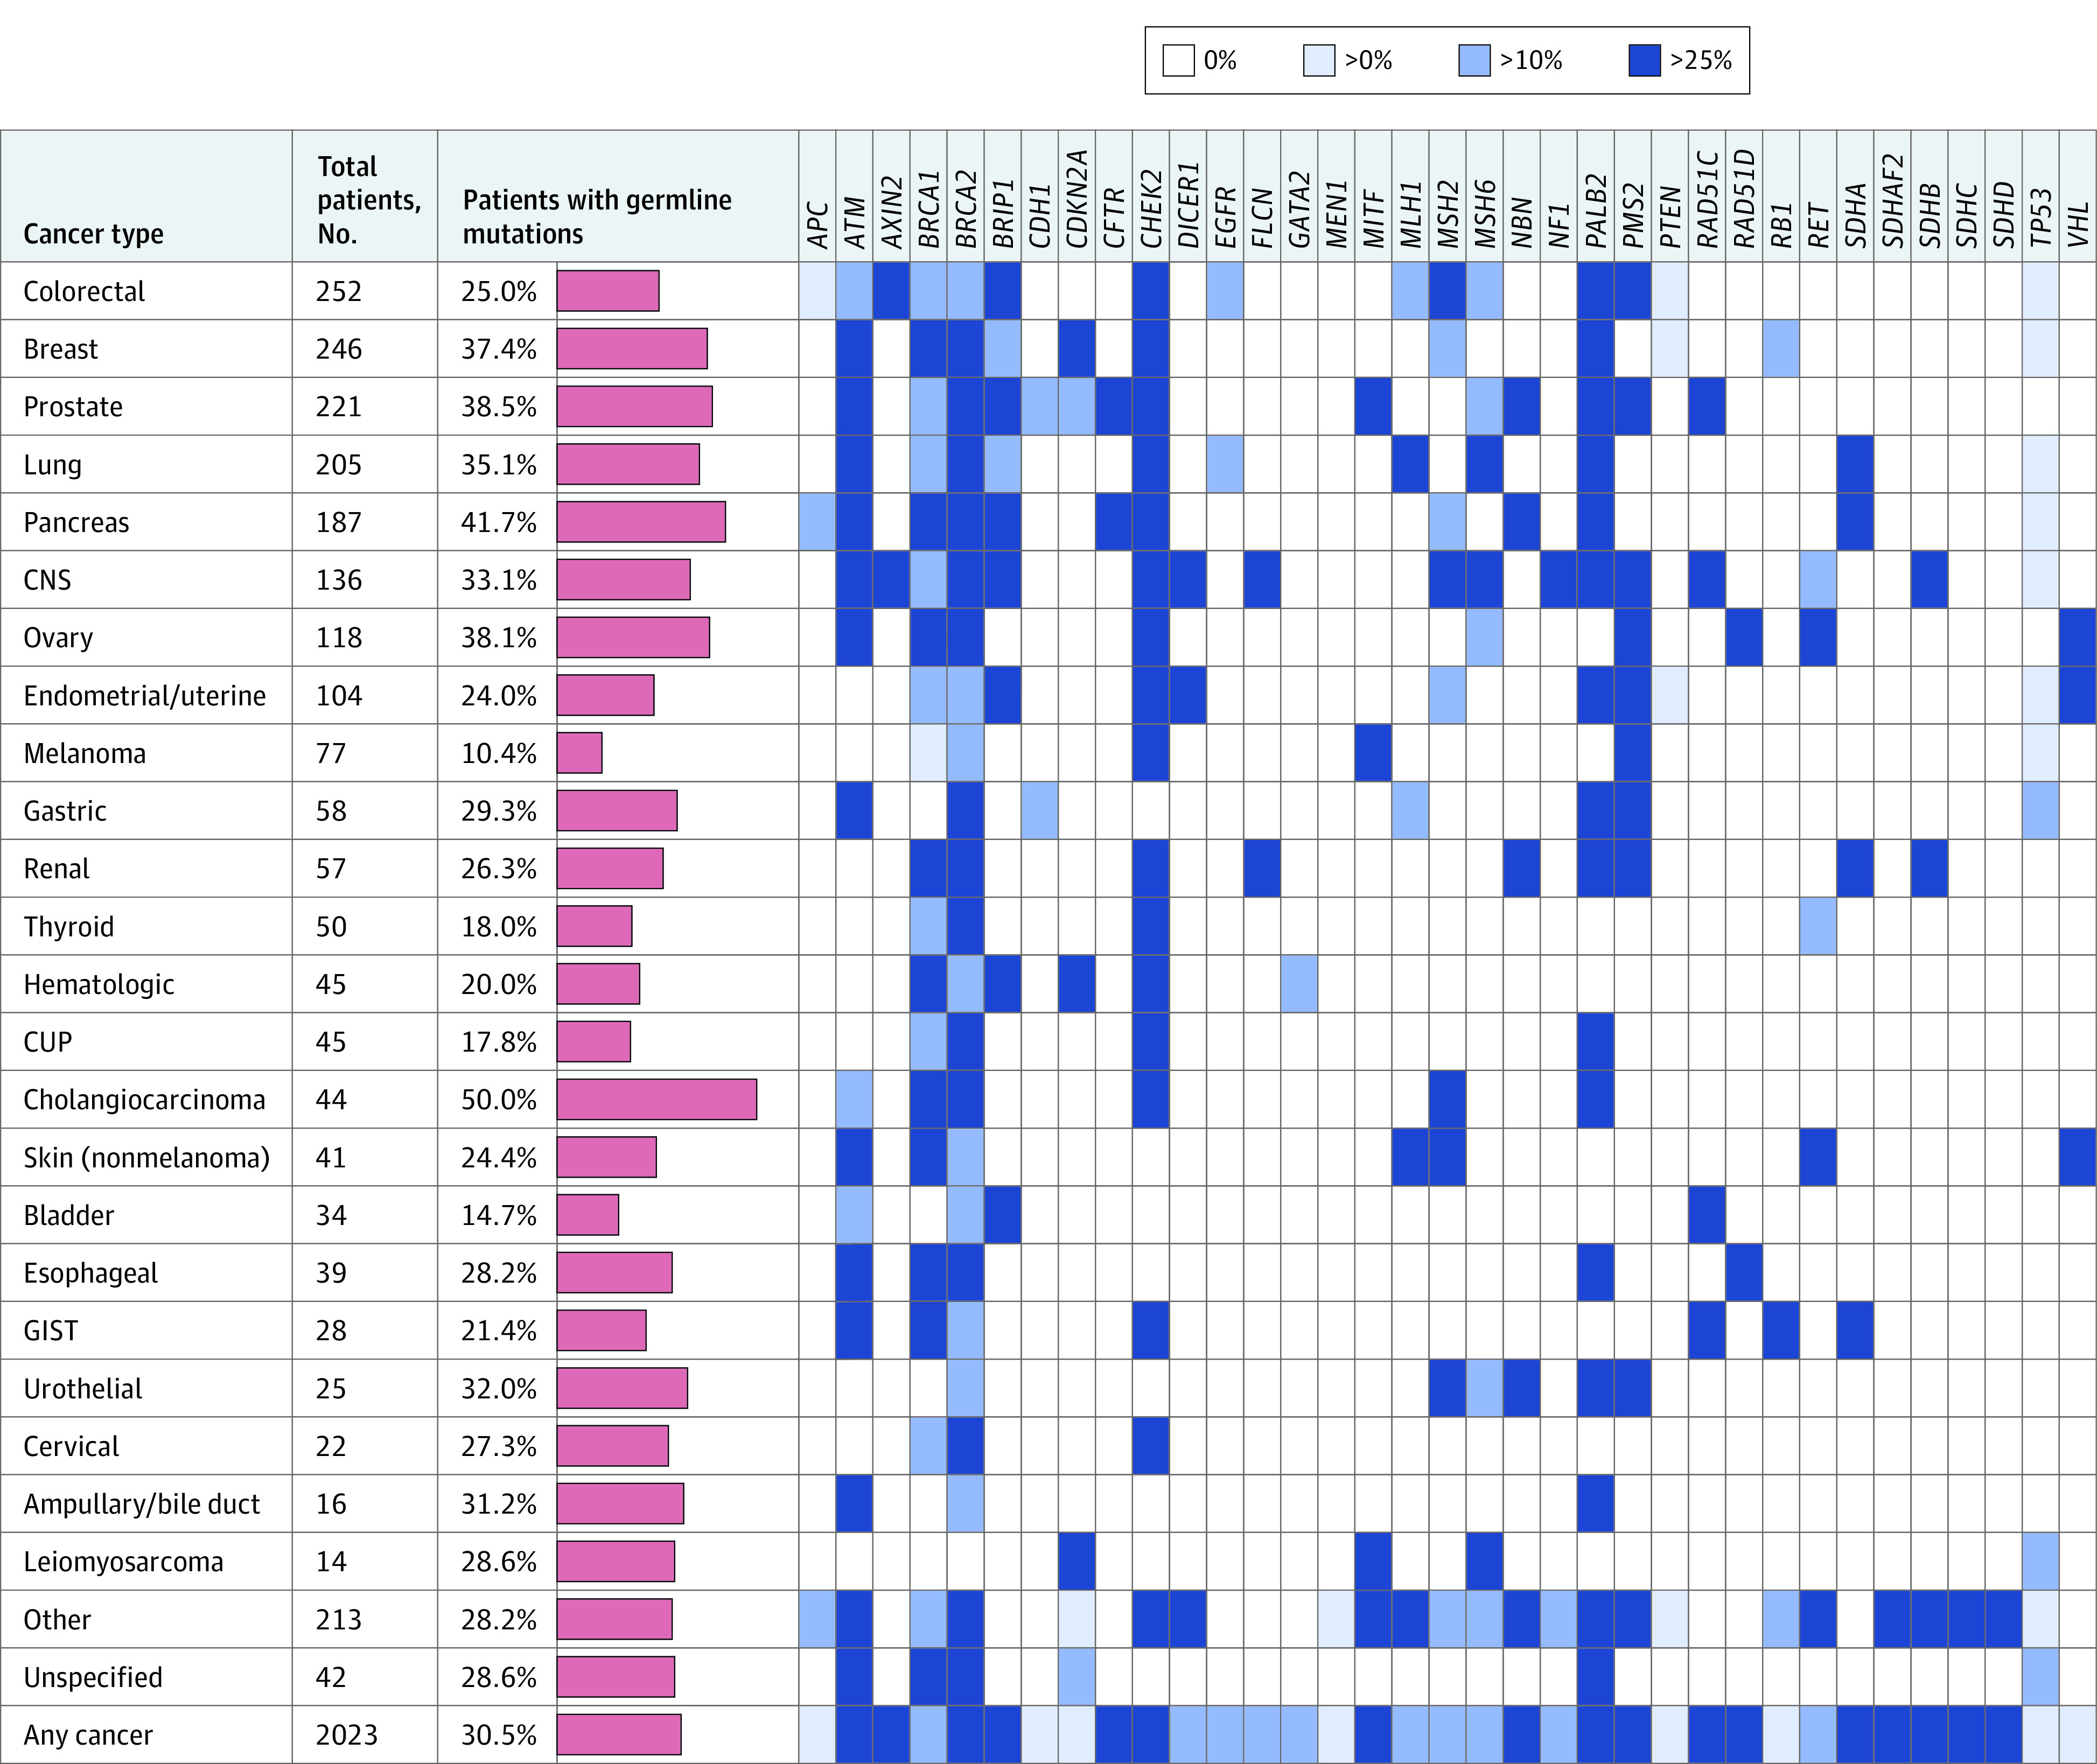
Figure 2. Prevalence of Pathogenic Germline Variants (PGVs), by Cancer Type and Gene.

Number of patients with each cancer type and percentage of patients found to harbor 1 or more pathogenic germline variants (red bars, scale 0%-60%). Patients with more than 1 primary cancer were counted more than once in this figure. In addition, a heatmap of germline findings by gene and cancer type is shown. Blue cells indicate cancer/gene combinations in which PGVs were observed, with the shade indicating the fraction of findings determined to be of germline origin. CNS indicates central nervous system; CUP, cancer of unknown primary; and GIST, gastrointestinal stromal tumor.
