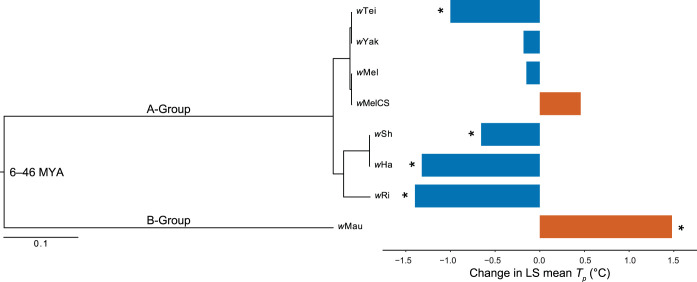
FIG 2.
Estimated Bayesian phylogram for A- and B-group Wolbachia strains examined in this study. The phylogram was estimated with 214 single-copy genes of identical length in all of the genomes, spanning 181,488 bp. All nodes have Bayesian posterior probabilities of 1. To the right, the change in least-square (LS) mean Tp between uninfected and infected flies is shown for each Wolbachia strain. LS means were generated from GLMMs (Table 1), and strains with a significant main effect on Tp are marked with an asterisk. The divergence time estimate (million years ago [MYA]) for A- and B-group Wolbachia is from Meany et al. (41).

