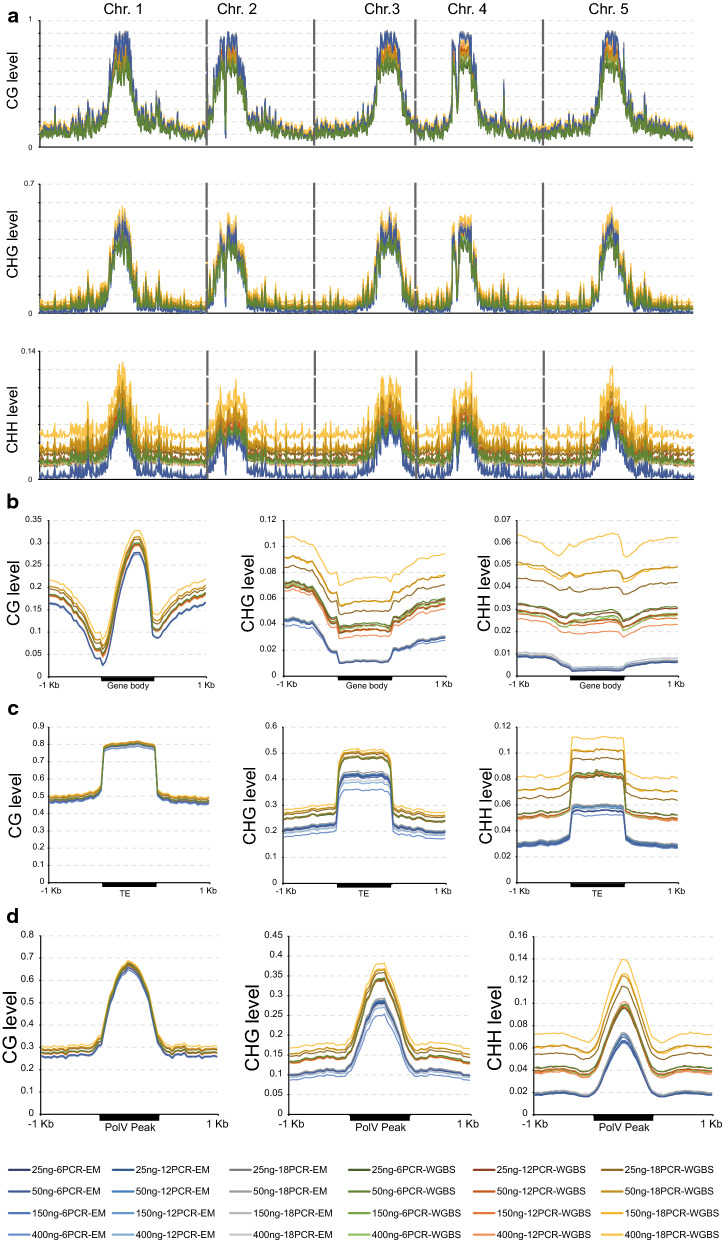
Fig. 4.
Comparison of methylation pattern between EM-seq and WGBS. a Chromosomal distribution of CG, CHG, and CHH methylations. Methylation levels are calculated in Arabidopsis chromosomes divided into 100 Kb bins. b Metaplots of CG, CHG, and CHH methylations over genes and 1 Kb flanking sequences. c Metaplots of CG, CHG, and CHH methylations over TEs and 1 Kb flanking sequences. d Metaplots of CG, CHG, and CHH methylations over PolV ChIP-seq peaks and 1 Kb flanking sequences. In a–d, colored lines represent different library preparations

