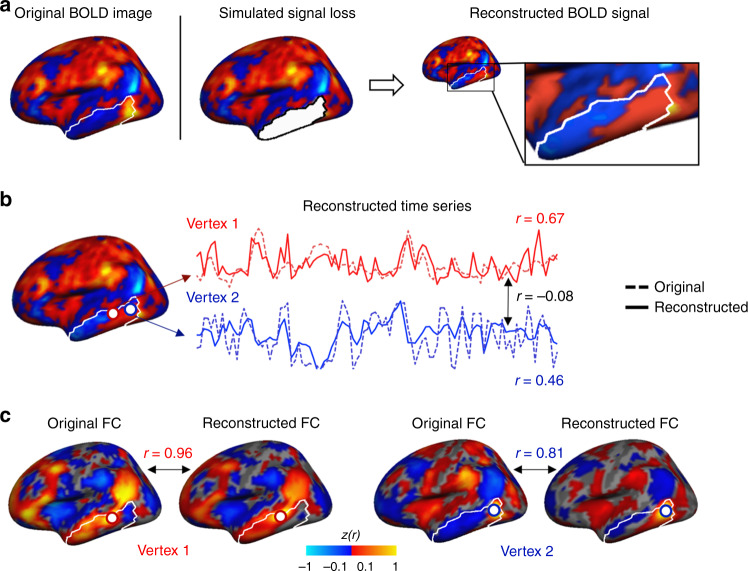
Fig. 2. The reconstructed BOLD signals are highly similar to the original signals.
a Here we show an example of an intact BOLD frame from a representative participant in the GSP data set, which we used to create an artificially compromised BOLD frame by removing the signal in a predefined region (here, a region within the temporal cortex). The compromised BOLD frame is fed to the trained DCGAN model, which then generates a reconstructed BOLD frame based on the information within the compromised frame. b The time series of two vertices in the reconstructed region are shown (solid lines), along with these vertices’ original time series taken from the intact BOLD frame (dashed lines). Each white circle represents a vertex. The reconstructed time series are highly similar to the original time series, as they exhibit high correlations (r = 0.67 for the left-most vertex outlined in red (Vertex 1) and r = 0.46 for the right-most vertex outlined in blue (Vertex 2)). To illustrate that the DCGAN model does not simply generate time series that follow the same fluctuations over time, we correlated the time series of the two generated vertices. The resulting correlation is r = −0.08, indicating that the DCGAN model takes into account the variability in activity between different vertices. c We investigated the functional connectivity (FC) maps of the original and reconstructed vertices. The two reconstructed FC maps show high similarity to the original FC maps (r = 0.96 for Vertex 1 and r = 0.81 for Vertex 2). These findings indicate that the DCGAN model is able to learn time-varying and functional connectivity characteristics of BOLD activity within individuals and to generate images that are highly realistic.

