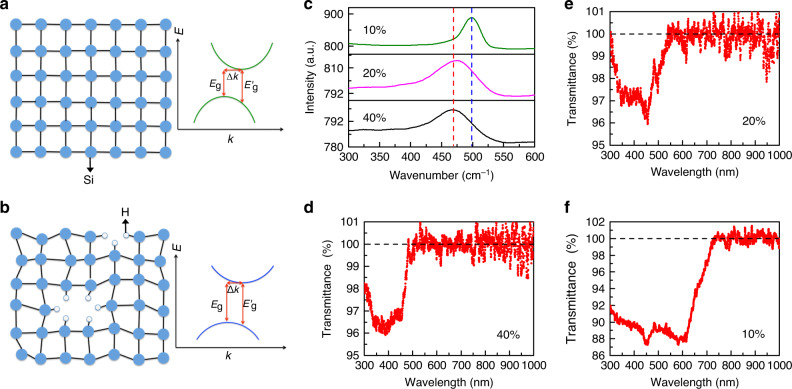
Fig. 1. Bandgap engineering of low-loss hydrogenated a-Si nanoparticles.
a, b Two-dimensional schematic representations of the atomic arrangement and the bandgap of c-Si (a) and a-Si:H (b). E is the energy, and k is the wave vector. Eg is the indirect bandgap, Eg′ is the direct transition, and Δk is the wave-vector mismatch. c Raman spectra of a-Si:H NPs with 40, 20, and 10% of hydrogen. The blue dashed line indicates the peak position of 495 cm−1, and the red dashed line labels the peak position of 470 cm−1. d–f Transmission spectra of a-Si:H NP(40) (d), a-Si:H NP(20) (e), and a-Si:H NP(10) (f) in ethanol after removing scattering signals.

