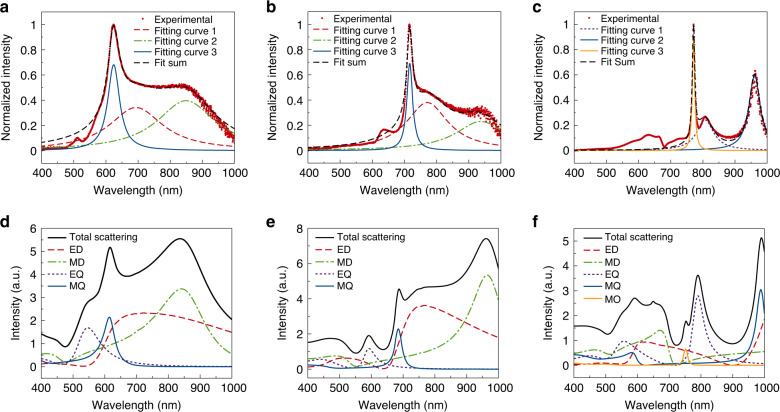
Fig. 2. Single-nanoparticle optical spectroscopy.
a–c Scattering spectra of a single a-Si:H NP(40) (radius of ~185 nm) (a), a-Si:H NP(20) (radius of ~160 nm) (b), and a-Si:H NP(10) (radius of ~207 nm) (c). The red dotted curve and black dashed curve are experimental data and fit summary, respectively. The red dashed curve, green doted-dashed curve, and blue curve are fitting curve 1, 2, and 3, respectively (a, b). Purple doted curve, blue curve, and dark yellow curve are fitting curve 1, 2, and 3, respectively (c). d–f Scattering spectra along with multipole decomposition calculated with Mie theory. The black curve, red dashed curve, green dashed-dotted curve, purple doted curve, and blue curve represent total, ED, MD, EQ, and MQ scattering, respectively (d–f). Dark yellow curve represents MO scattering (f).

