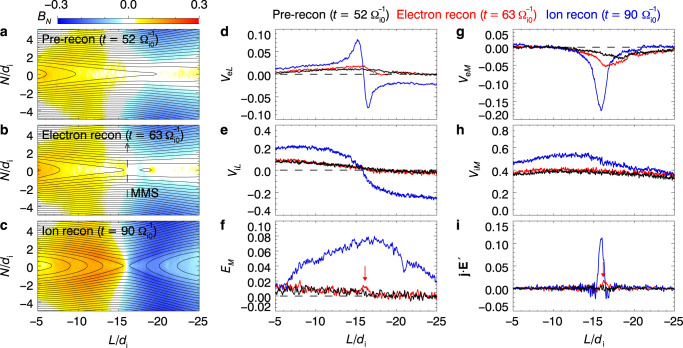
Fig. 3. PIC simulations of strongly externally driven onset of magnetotail reconnection.
a–c Colors show the normal magnetic field BN (in unit of B0) in the L–N plane at pre-reconnection phase (), electron reconnection phase (), and ion reconnection phase (), respectively. The black curves represent the magnetic field lines in the reconnection plane. d–i Profiles, along N = 0, of VeL (in unit of VeA), ViL (in unit of VA), EM (in unit of VAB0), VeL (in unit of VeA), ViL (in unit of VA), and j · E′ (in unit of ) at pre-reconnection phase (, black curves), electron reconnection phase (, red curves), and ion reconnection phase (, blue curves). The dashed line with an arrow in b represents the virtual trajectory of the MMS spacecraft across the electron reconnection region, along L = −16.1di at . The red arrows in f, i mark the location of the electron reconnection site.

