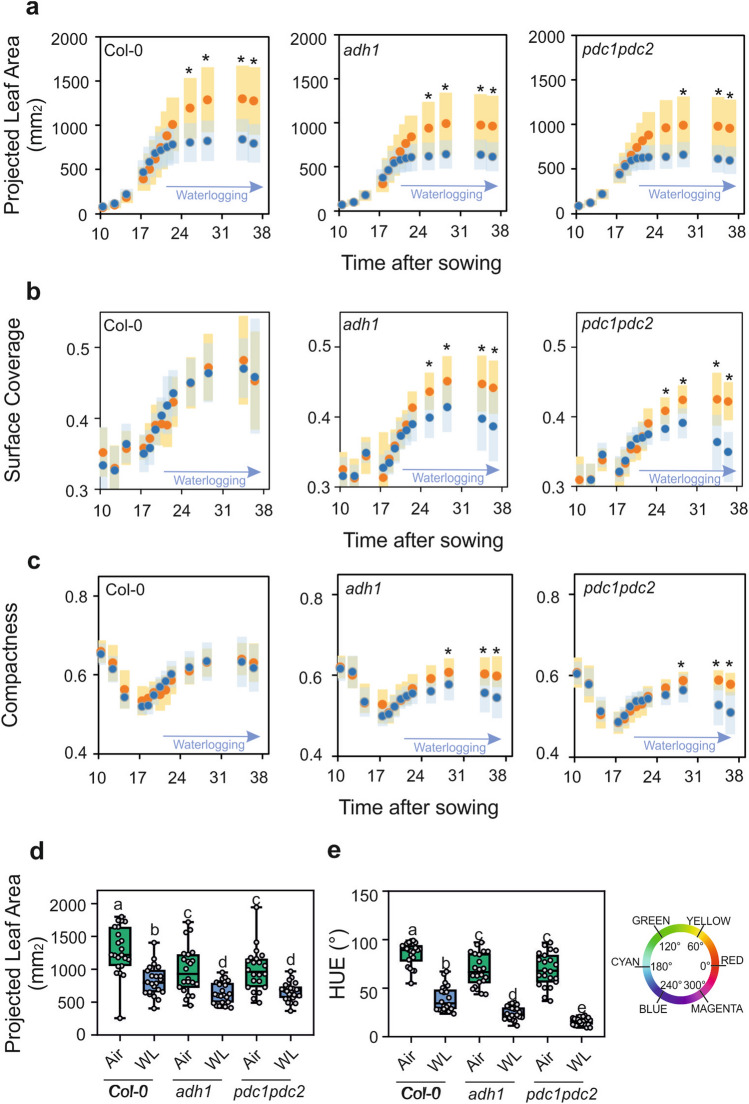
Figure 4.
Plant size (a) and morphology traits (b, c) plotted against time in aerobic plants (orange symbols) compared to plants that were waterlogged (blue symbols). Variance (± SD, n = 22) is shown as color-shaded areas (yellow: aerobic; light blue: waterlogging). Statistically significant differences are indicated by an asterisk (T test, pairwise comparison at each time point, * = p < 0.01). (d) Plant size (projected leaf area) in aerobic plants (green box) compared to plants that were waterlogged (blue box). Data were taken at day 28. (e) Color (HUE-value from HSI color space) in aerobic plants (green box) compared to plants that were waterlogged (blue box). The color wheel gives values for HUE ranging from 0 to 360°. Data were taken at day 28. Lines in the boxes indicate the median. The bottom and top of each box denote the first and third quartile, respectively. The dots represent the single data points and whiskers denote the min/max values. Different letters indicate statistically significant differences (ANOVA).

