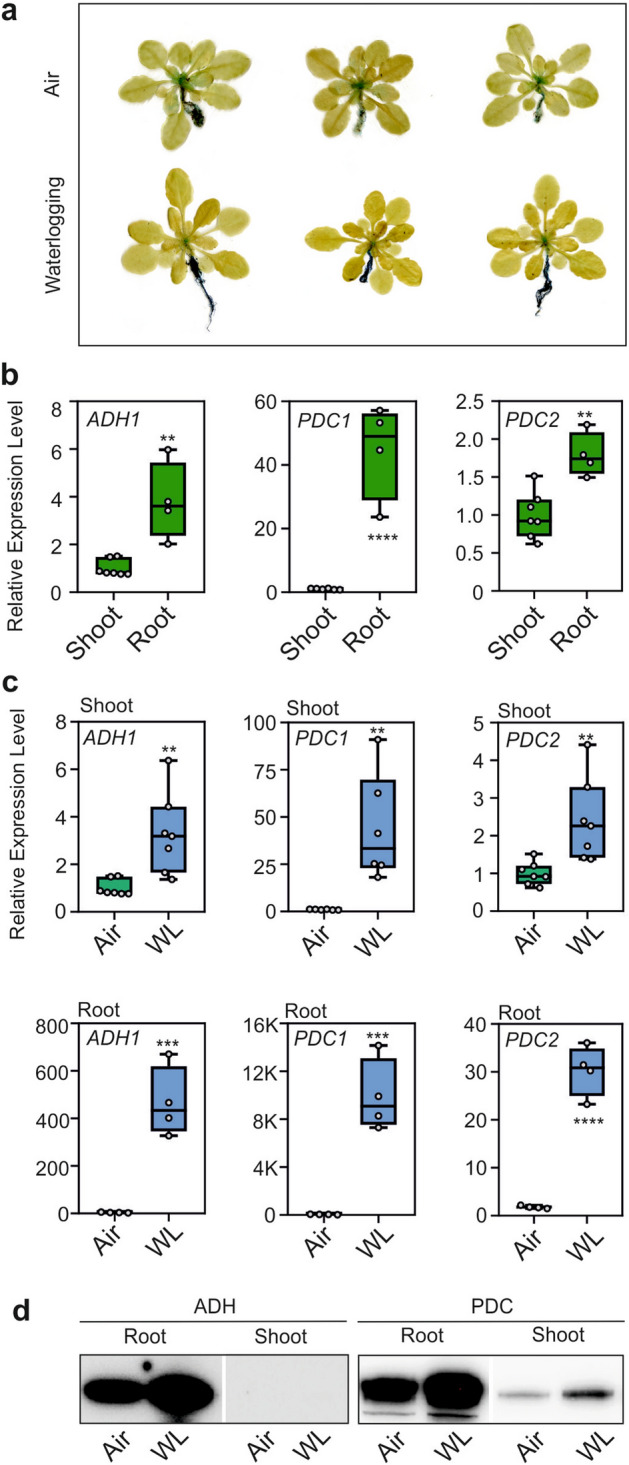
Figure 7.

Expression of ADH1 and PDC1 in aerobic and waterlogged Arabidopsis plants. (a) GUS staining of pADH1:GUS plants in air or 5-day waterlogging. (b) Comparison of the expression (RT-qPCR) of ADH1, PDC1, and PDC2 in roots and shoots of aerobic plants. (c) Comparison of the expression (RT-qPCR) of ADH1, PDC1, and PDC2 in air (green box) vs. 5-day waterlogging (WL, blue box). Lines in the boxes indicate the median. The bottom and top of each box denote the first and third quartile, respectively. The dots represent the single data points and whiskers denote the min/max values. Statistically significant differences are indicated by an asterisk (T test, pairwise comparison at each time point, * = p < 0.05; ** = p < 0.01; *** = p < 0.001; **** = p < 0.0001). (d) Immunoblot analysis of proteins in aerobic and waterlogged plants. Equal loading was verified by protein staining (Figure S4).
