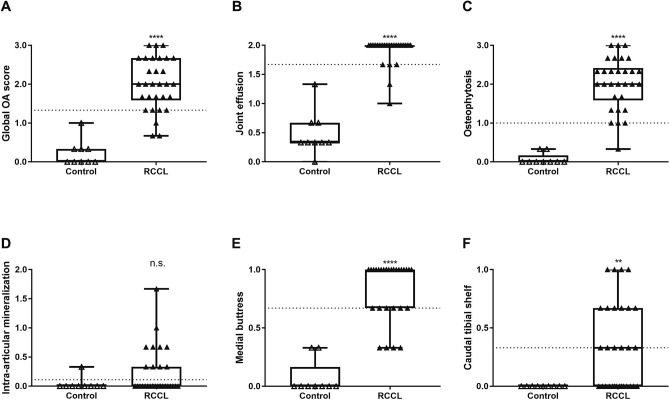
Figure 1.
Radiographic evidence of OA in control (n = 9) and RCCL (n = 30) groups, scored by three independent observers. (A) Global OA score on the scale of 0–3; (B) joint effusion score on the scale of 0–2; (C) osteophytosis score on the scale of 0–3; (D) intra-articular mineralization score on the scale of 0–2; E) medial buttress score on the scale of 0–1 and (F) caudal tibial shelf score on the scale of 0–1. Data are displayed as box-and-whisker plots representing the first and third quartiles, median and range of concentrations for each score. Dotted line: RCCL vs. control threshold obtained by receiver operating characteristic (ROC) curve. ** p < 0.01, *** p < 0.001, **** p < 0.0001 for Wilcoxon test, α = 0.05.

