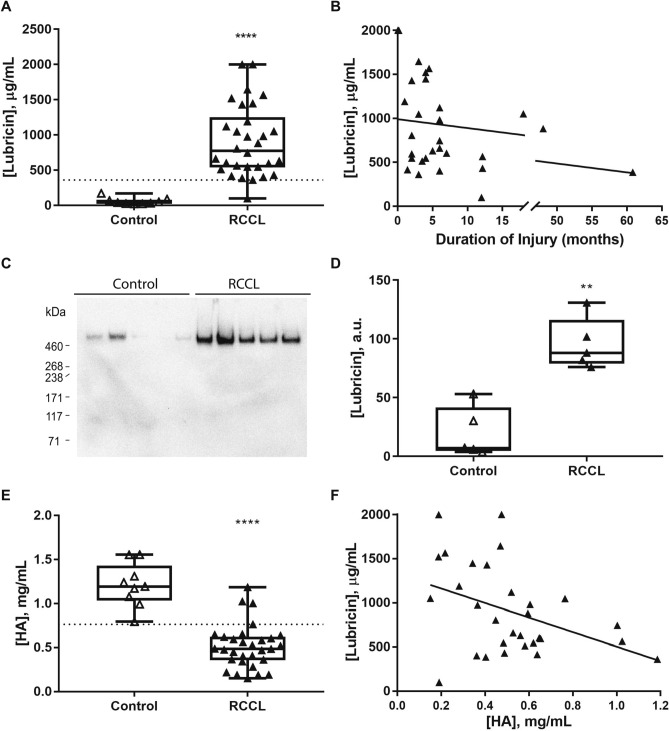
Figure 2.
Canine synovial fluid lubricin and HA quantification. (A) Canine synovial fluid lubricin concentrations in control (n = 9) and RCCL (n = 30) joints. Dotted line: RCCL vs. control threshold (361.72 µg/mL) obtained by ROC curve. (B) Synovial fluid lubricin concentration plotted as a function of injury duration in dogs with RCCL (n = 30), solid line: R2 = 0.07, Spearman’s correlation test ρ = -0.35, n.s. C) Anti-lubricin (mAb 9G3, MABT401) western blots of synovial fluid from 5 randomly selected control and RCCL dogs. (D) Quantification of western blot in part C, reported as absorbance units (a.u.). (E) Synovial fluid HA concentration, dotted line: RCCL vs. control threshold (0.76 mg/mL) obtained by ROC curve. (F) Synovial fluid lubricin vs. HA concentrations for dogs with RCCL, R2 = 0.17, Spearman’s correlation test ρ = -0.41, p = 0.03. ** p < 0.01, **** p < 0.0001 for Wilcoxon test, α = 0.05.

