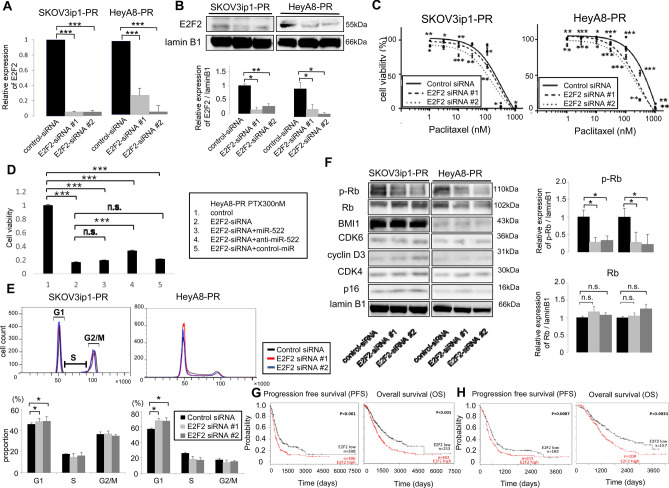
Figure 5.
Knockdown of E2F2 attenuated paclitaxel resistance in paclitaxel-resistant cells thorough G0/G1 arrest. (A) The quantitative reverse transcription polymerase chain reaction findings for the relative expression of E2F2 (vs. control siRNA) in paclitaxel-resistant cells transfected with E2F2-siRNAs. (B) The western blot findings for E2F2 in paclitaxel-resistant cells transfected with control-siRNA or E2F2-siRNAs (left, SKOV3ip1-PR cells; right, HeyA8-PR cells) (upper). Densitometric ratio of the expression of E2F2 / lamin B1 (lower). (C) At 24 h after transfection with control-siRNA or E2F2-siRNAs, the cells were treated using paclitaxel for 48 h (HeyA8-PR) or 72 h (SKOV3ip1-PR) before the cell viability was assessed based on the MTS assay. MTS assays were performed in triplicate. Data are represented as mean ± standard deviation (SD) and were obtained from three independent experiments. (D) After transfection with control-miR, E2F2-siRNA, E2F2-siRNA + miR-522, E2F2-siRNA + anti-miR-522 or E2F2-siRNA + control-miR, the HeyA8-PR cells were treated using 300 nM paclitaxel for 48 h and then cell viability was assessed based on the MTS assay. (E) Paclitaxel-resistant cells were transfected with control-siRNA or E2F2-siRNAs, and stained using propidium iodide. Cell cycle findings were evaluated based on flow cytometry (upper: representative flow histograms, lower: percentages of cells in G1, S, and G2/M). Data are represented as mean ± SD and were obtained from three independent experiments. (F) Western blot findings of the expression of E2F2 and cell cycle-related proteins in paclitaxel-resistant cells transfected with control-siRNA or E2F2-siRNAs (left: SKOV3ip1-PR cells, right: HeyA8-PR cells) (left). Densitometric ratio of the expression of phospho-retinoblastoma protein (RB) and RB / lamin B1 (right). (G) The Kaplan–Meier curves for progression-free survival (PFS; left) and overall survival (OS; right) according to high or low E2F2 expression among 657 ovarian cancer patients. (H) Kaplan–Meier curves for PFS (left) and OS (right) according to high and low E2F2 expression among 381 patients who received chemotherapy that included paclitaxel. Data are presented as mean ± SD from three independent experiments. *P < 0.05, **P < 0.01, ***P < 0.001.

