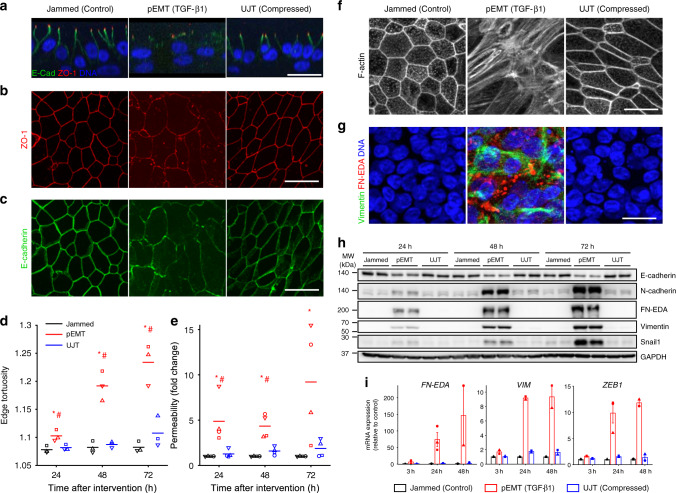
Fig. 2. UJT occurs without evidence of pEMT.
Representative immunofluorescence (IF) images (a–c, f, g) at 48 h after stimulus for jammed (control), pEMT (TGF-β1-treated), and UJT (compressed) layers. Scale bars in all images are 20 µm. See also Supplementary Figs. 1 and 2. a In both jammed and UJT layers, ZO-1 (red) localizes at apical tight junctions, while E-cadherin (green) localizes at lateral adherens junctions, consistent with the epithelial phenotype; DNA is shown in blue. In pEMT layers, both ZO-1 and E-cadherin delocalize from apical and lateral junctions, consistent with the mesenchymal phenotype. b, c In both jammed and UJT layers, apical tight junctions (ZO-1, b) and lateral adherens junctions (E-cadherin, c) remain intact, while in pEMT layers the cell edges comprised of these junctions become disrupted. d During UJT, cells elongate while maintaining straight cell edges, while during pEMT, cell–cell edges become progressively tortuous (n = 3 donors, independent experiments). e Layer permeability measured by the dextran-FITC (40 kDa) flux assay significantly increases during pEMT but remains almost unchanged during UJT (n = 4 donors, independent experiments). *p < 0.05, vs. control; #p < 0.05, pEMT vs. UJT, color-coded according to which sample is referenced, one-way ANOVA followed by post-hoc multiple comparisons test with Bonferroni correction d, e. f During pEMT, cortical actin becomes disrupted while apical stress fibers emerge, indicating loss of epithelial character and gain of mesenchymal character. During UJT, cells maintain intact cortical F-actin; aside from elongated cell shape, cortical actin in jammed versus UJT is indistinguishable. g IF images stained for mesenchymal marker proteins: cellular fibronectin (FN-EDA, red) and vimentin (green). FN-EDA and vimentin appear during pEMT but not UJT. Vimentin appears as basally located fibers, while FN-EDA appears as cytoplasmic globules. h During pEMT, E-cadherin protein levels progressively decrease while mesenchymal markers, N-cadherin, FN-EDA, and vimentin, and the EMT-inducing transcription factor (TF) Snail1, progressively increase. During UJT, these protein levels remained unchanged. Western blot quantification shown in Supplementary Figs. 2, 3, and uncropped versions of the blots are available in the accompanying online Source Data file. i During pEMT, mRNA expression of mesenchymal markers, shown as fold-change relative control, VIM and FN-EDA and the EMT-inducing TF ZEB1, are significantly elevated, but during UJT remain unchanged. Shown: mean ± SEM for n = 3 donors with overlaid data points showing fold-change for each donor.

