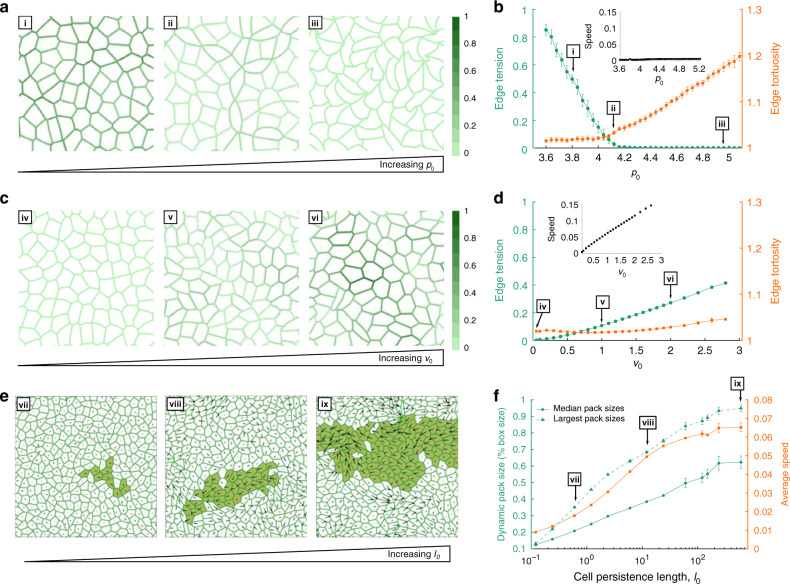
Fig. 4. Changes in tension, propulsion. and persistence in the dynamic vertex model (DVM) leads to different modes of fluidization in a confluent cell layer.
a When p0 is small and propulsive forces (v0) are sufficiently small, the cell layer is jammed (i). Cells on average assume compact polygonal shapes37,109, and cell–cell junctions are straight. As p0 progressively increases cell shapes become elongated (ii) and cell edges become increasingly tortuous, as if slackened (iii). Further, as p0 increases, tension in the cell edges decreases (depicted by color intensities). b Increasing p0 decreased mean edge tension (green), with a transition near p0 = 4.1, at which point edge tensions dropped to near zero and edge tortuosity began to rise (orange). This loss of edge tension coincides with a solid–fluid transition of the layer, at which point the shear modulus114 and energy barriers vanish (Supplementary Fig. 4a). c If p0 is moderate (p0 = 4) and propulsive force v0 is small the cell layer is immobile (iv). As v0 is progressively increased, however, cell shapes elongate but cell–cell junctions remain straight (v, vi). Further, as v0 increases, edge tensions increase. d Increasing v0 increases edge tension (green) but without an increase in edge tortuosity (orange). Simultaneously, the speed of the cell migration increases (inset). This increase in cell speed coincides with fluidization of the layer: v0 becomes sufficient to overcome energy barriers that impede cellular rearrangements. Data presented in b and d are mean ± SD for n = 7–20 independent simulations for each datapoint. e Increasing the single cell persistence length l0 (in units of the average cell diameter, see Supplementary Methods) at constant p0 = 4 and v0 = 1.2 leads to the emergence of growing migrating packs (vii–ix)92,126. Single cell velocity is represented as a vector; the largest pack is highlighted. f The median size of migrating packs (green circles) and corresponding average cell speeds (orange squares) increase in tandem as l0 increases. Data presented in f are mean ± SD for n = 8–9 independent simulations for each datapoint. The linear sizes of the packs are measured relative to the size of the simulation window (Supplementary Methods). The largest migrating packs are also shown (green triangles), which grow to the size of the simulation window for l0 > 100, highlighting the scalability and robustness of pack formation in DVM.

