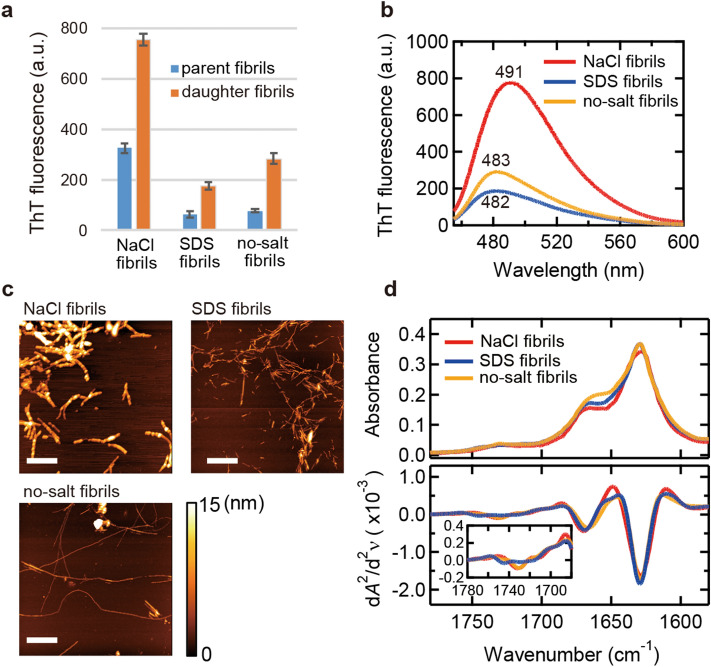
Figure 1.
Basic properties of three types of insulin amyloid fibrils prepared in the presence of NaCl (NaCl fibrils) or SDS (SDS fibrils) or in its absence (no-salt fibrils). (a) ThT fluorescence intensity. Blue and orange bars represent fluorescence intensity of parent and daughter fibrils, respectively. All measurements were performed three times and the error bars depict the S.D. ± mean. (b) ThT fluorescence spectra of daughter fibrils. (c) AFM images of daughter fibrils. The white scale bars represent 1 µm. The color scale bar represents the height of samples. (d) ATR-FTIR absorption spectra (upper panel) of daughter fibrils and their second derivatives (lower panel) in amide I region. Amyloid fibrils subjected to these measurements were formed at an insulin concentration of 2.0 mg/ml.

