Figure 2.
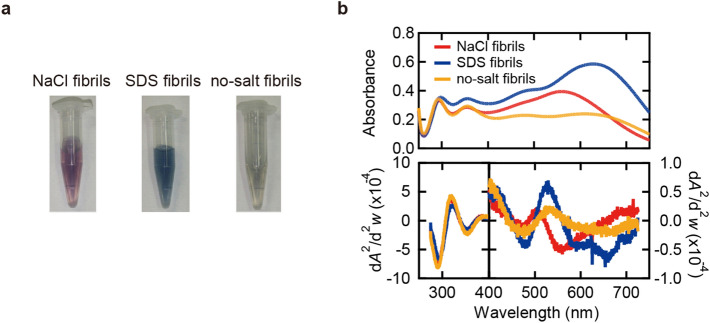
Color properties of iodine-stained insulin amyloid fibrils. (a) Photographs of samples of iodine-stained NaCl fibrils, SDS fibrils, and no-salt fibrils. (b) Absorption spectra of iodine-stained fibrils in UV–Vis region (upper panel) and their second derivatives (lower panel). For each absorption spectrum, the spectrum of unstained fibrils was subtracted to obtain a net spectrum derived from iodine. It should be noted that the scales of the vertical axes for the region of 400–740 nm and that of 260–400 nm are different in the lower panel. The conditions of iodine staining were 0.25 mg/ml daughter fibrils, 0.3 mM KI and 0.04 mM I2 in 25 mM HCl.

