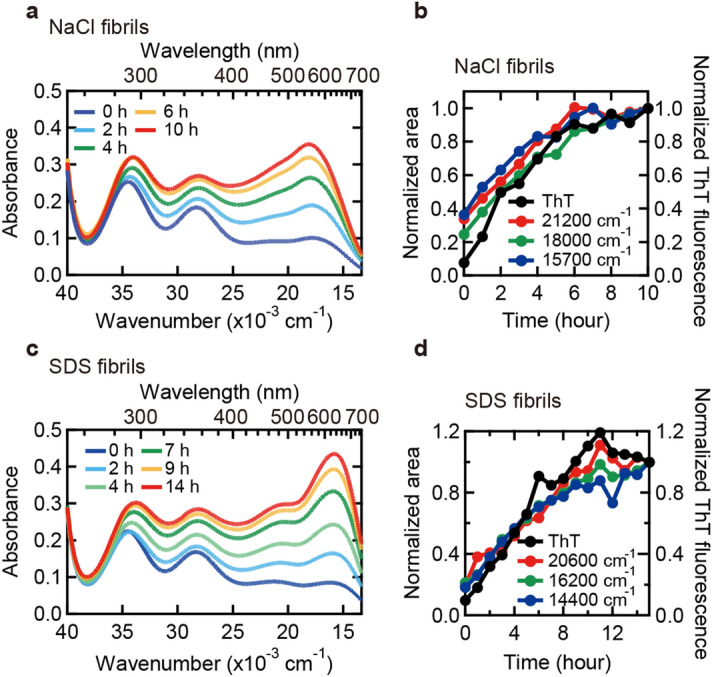
Figure 4.

Tracking seed-dependent fibril growth by iodine staining. (a–d) Time dependent changes in iodine color of NaCl (a,b) and SDS fibrils (c,d). In panels (a and c), UV–Vis spectra of NaCl (a) and SDS fibrils (c) stained with iodine monitored at different time are shown. The conditions of iodine staining were 0.25 mg/ml insulin, 0.3 mM KI and 0.04 mM I2 in 25 mM HCl. In panels (b and d), areas of the three absorption bands of NaCl fibrils (b) and SDS fibrils (d) in the low wavenumber region (e.g., filled bands in Fig. S4c-h) are plotted against reaction time. For details about spectral deconvolution for the determination of these absorption bands, see Fig. S4. ThT fluorescence intensity which was measured concurrently is also plotted in each panel for comparison.
