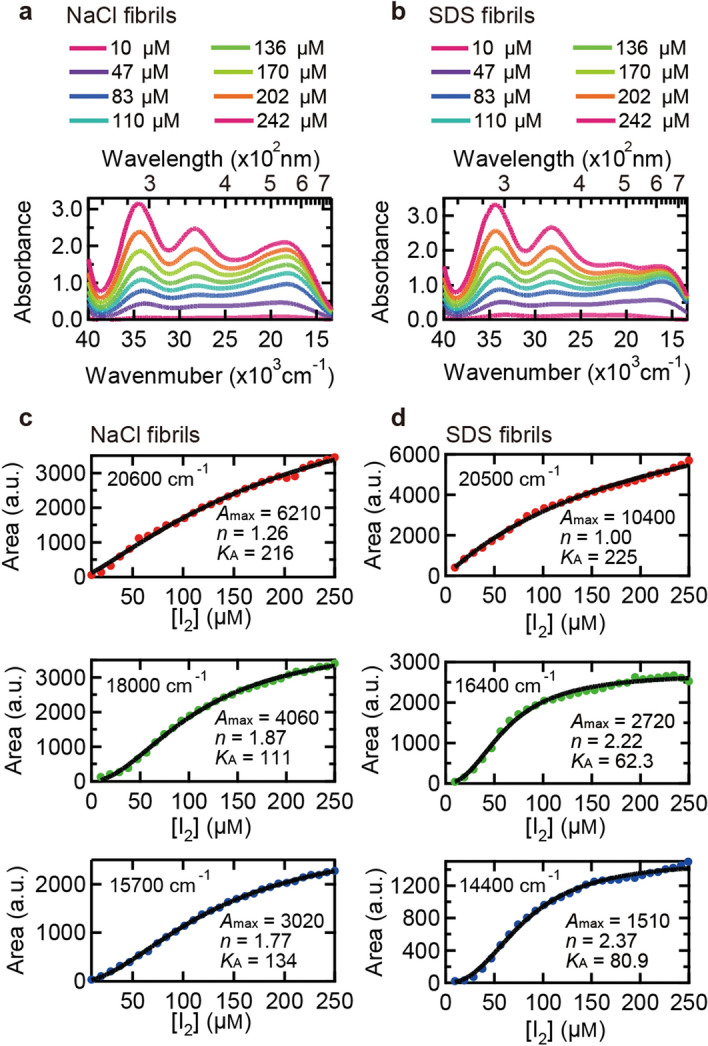
Figure 6.

Titration of insulin fibrils with iodine solution. 0.5 mg/ml daughter fibrils in 25 mM HCl and iodine solution containing 18 mM KI and 2.4 mM I2 in 25 mM HCl were used as an analyte and a titrant, respectively. (a,b) Examples of absorption spectra of NaCl (a) and SDS fibrils (b) measured at different concentrations of iodine solution. (c,d) Iodine concentration dependence of area of the three absorption bands of iodine-stained NaCl or SDS appearing in the low wavenumber region (e.g., filled bands in Fig. S5c-h). In these plots, the concentration of I2 in the titrant iodine solution is represented as the scale of horizontal axes. For details about spectral deconvolution for the determination of these absorption bands, see Fig. S5. Black lines represent fitted curves using Eq. (2) and parameters obtained from the fitting are represented inside the panels.
