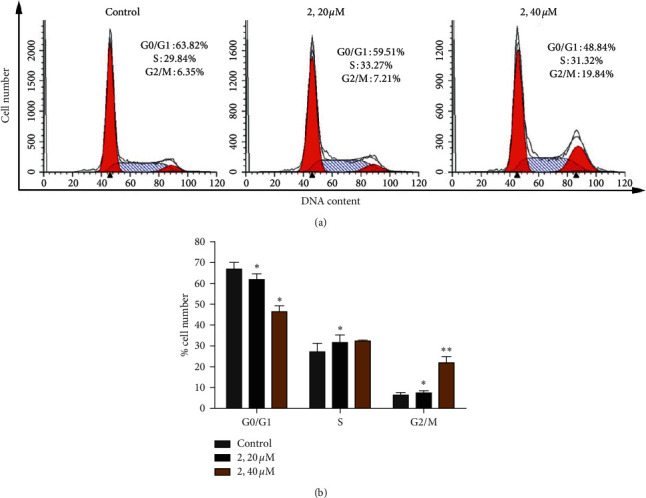
Figure 7.

(a) Cell cycle distribution was performed by PI staining after being coincubated with complex 2 (0, 20, and 40 μM) for 24 h. (b) Quantitative data analysis for the number of cells (% of total) in each cell phase for different treatment groups. Data were presented as mean ± SD (n = 3), Student's t-test, ∗P < 0.05, ∗∗P < 0.01.
