
Figure 1.
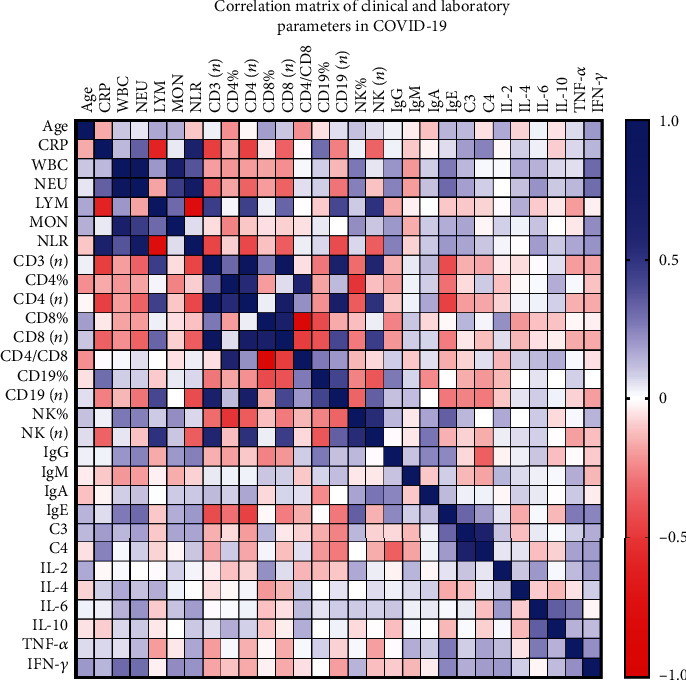
Correlation matrix of clinical and laboratory parameters in COVID-19 Spearman's correlation coefficients between two pairs of variables is shown in the heat map. The correlation coefficients are represented in terms of the change of the intensity of red/blue color, as shown in the color bar.