Figure 2.

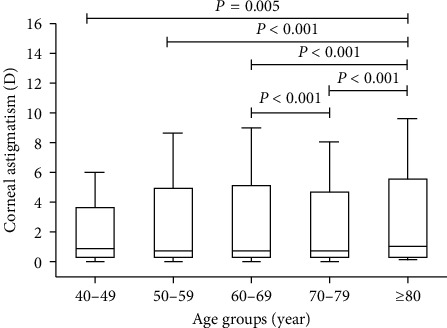
Corneal astigmatism in different age groups. Boxes show the interquartile range. Bold lines in boxes represent the median, and the whiskers represent extreme values.

Corneal astigmatism in different age groups. Boxes show the interquartile range. Bold lines in boxes represent the median, and the whiskers represent extreme values.