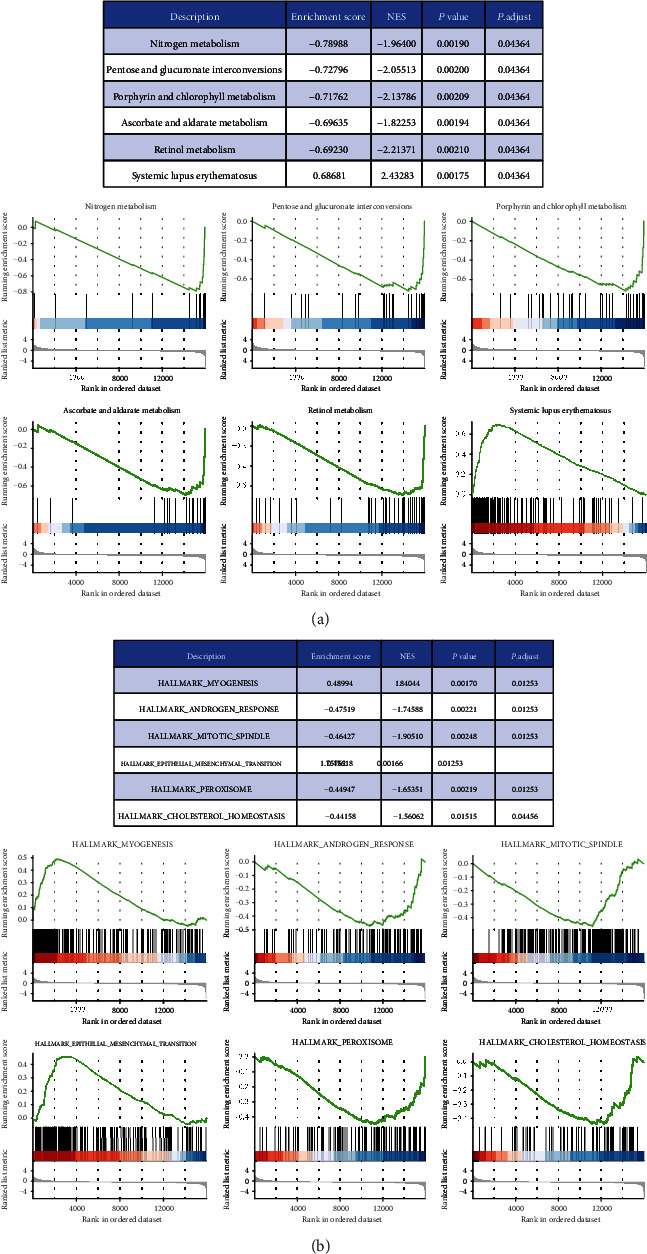
Figure 5.

GSEA of differential genes between the low- and high-expression groups of ATP8B1 was performed, and the top six items of significant enrichment scores were identified. The left side represents the ATP8B1 low-expression group, and the right side represents the ATP8B1 high-expression group in each GSEA diagram: (a) KEGG pathway gene sets and (b) hallmark gene sets.
