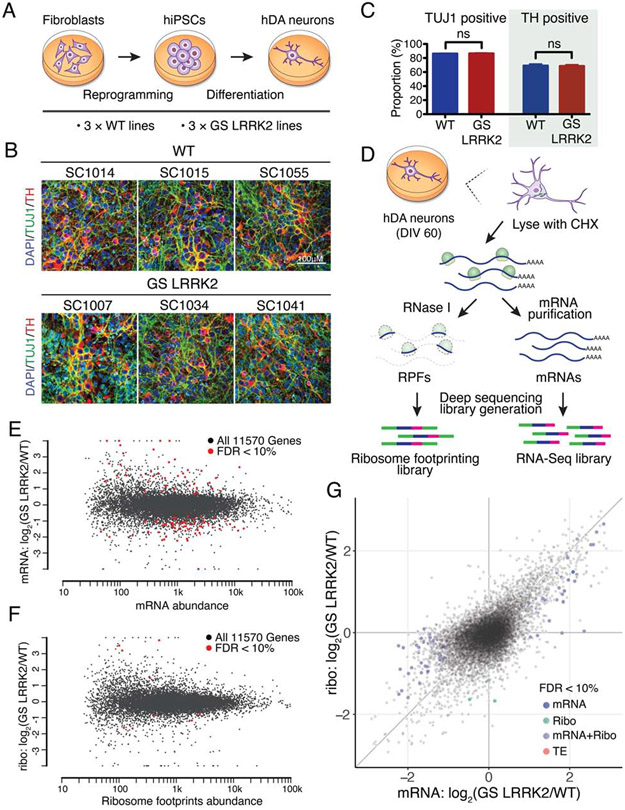
Figure 1. Altered translatome in G2019S LRRK2 human dopamine neurons.
(A) A schematic for the generation of human DA neurons. (B and C) Assessing the efficiency of DA differentiation. n=6, independent measurements per line. Unpaired t-test, mean ± SEM. ns=no significance. (D) A schematic of ribosome profiling. (E and F) MA plots for RNA-seq and ribosome profiling, respectively. Genes with >2-fold changes with FDR<10% were highlighted. Read abundance: mapped reads in log10 scale. (G) Scatterplot comparing RNA-seq and ribosome profiling. Genes with FDR<10% were highlighted. All values are in log2, each data point represents a single transcript. See also Figures S1 to S3, Table S1 and S2.

