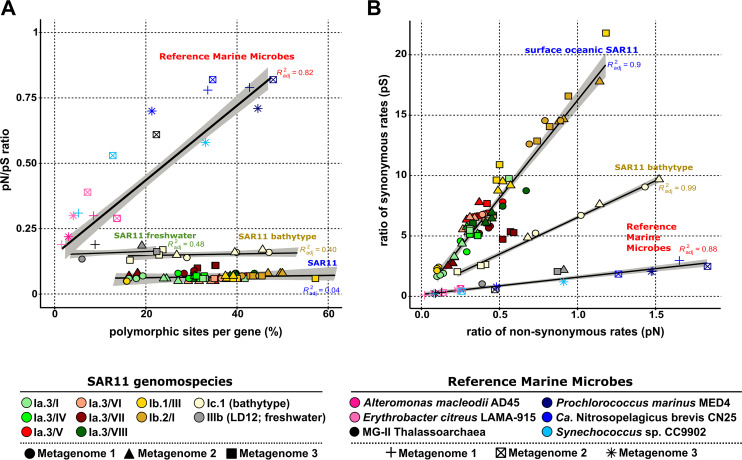
FIG 1.
(A) Comparison of the ratio of nonsynonymous to synonymous substitutions (pN/pS ratio) (y axis) against the percentage of polymorphic sites per gene (x axis). (B) Comparison of the ratio of synonymous (y axis) to nonsynonymous (x axis) rates. Linear regressions and R2 values are indicated for the different groups: (i) surface oceanic SAR11, (ii) SAR11 bathytype, (iii) SAR11 freshwater, and (iv) reference marine microbes.

