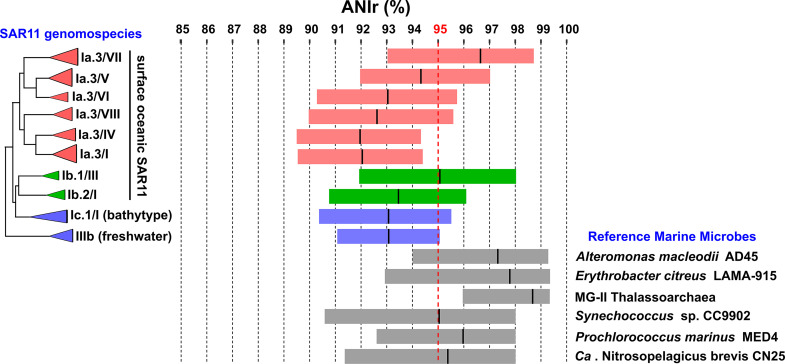
FIG 2.
Box plot indicating the average nucleotide identity based on metagenomic reads (ANIr) among SAR11 subclades and some reference marine microbes. Boxes in red represent different genomospecies belonging to the Ia.3 subclade, while boxes in green belong to the Ib subclade. Boxes in blue represent two different SAR11 ecotypes, one collected from bathypelagic waters (subclade Ic) and the other from freshwater samples (subclade IIIb). The red dotted line indicates the species threshold (95% identity). A maximum likelihood phylogenomic tree of the SAR11 genomospecies is shown on the left.

