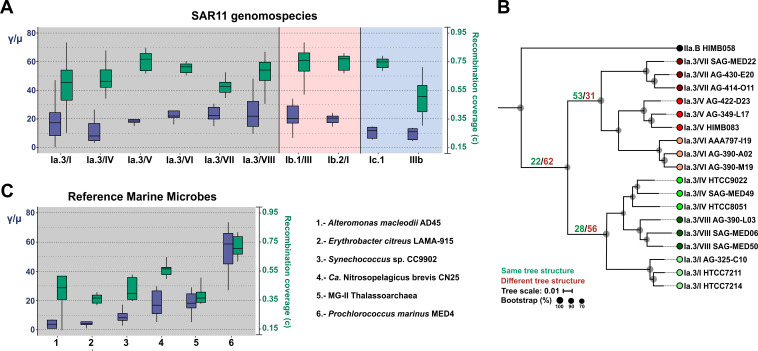
FIG 3.
(A) Box plot showing the ratio of recombination to mutation (γ/μ) (left y axis) (blue boxes) and the fraction of the sample diversity (c) that results from recombination events (right y axis) (green boxes). (B) Phylogenomic tree of the Ia.3 subclade using 232 shared proteins in common and considering only the three most complete genomes per genomospecies. The isolated genome of HIMB058, which belongs to a distant subclade, was used as an outgroup. Numbers located in the three most ancient branches and in green or red indicate the number of proteins that, after an individual phylogenetic analysis, produced or failed to rescue the same topology, respectively. Bootstrap values are indicated as black circles on the nodes. (C) Similar to panel A but with some reference marine microbes.

