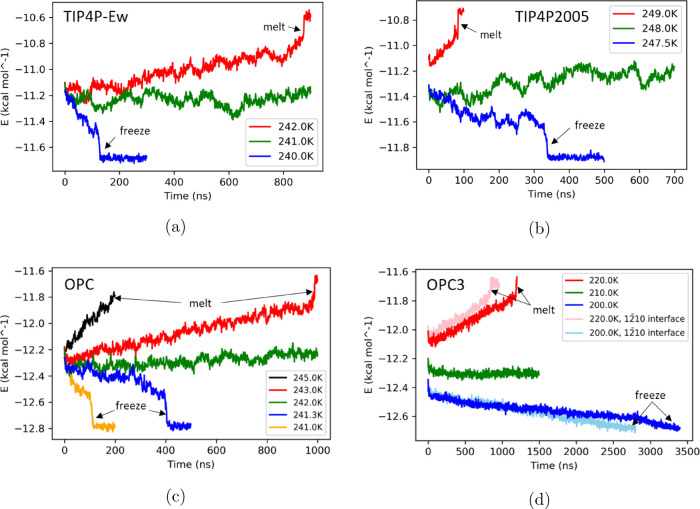
Figure 3.
Total energy (per mole) of the ice-liquid coexistence system for (a) TIP4P-Ew, (b) TIP4P/2005, (c) OPC, and (d) OPC3 models. The blue, green, and red curves represent total energy recorded for simulations at each model’s low, medium, and high temperatures, respectively. The peak at the end of a red curve shows the point where the whole simulation box becomes liquid. The flat “tail” region at the end of a blue curve corresponds to the state where the whole box is frozen. In (c), additional curves (yellow and black) at different temperatures are shown. With the temperature farther away from the melting point, the phase transition is faster. In (d), the pink and light blue curves are OPC3 simulations with the ice secondary prism (12̅10) plane as the interface. Also note in (d), the blue and light blue curves of OPC3 model do not have the flat “tail”, but we still observed the whole box becoming ice at the last few time steps of the simulation.

