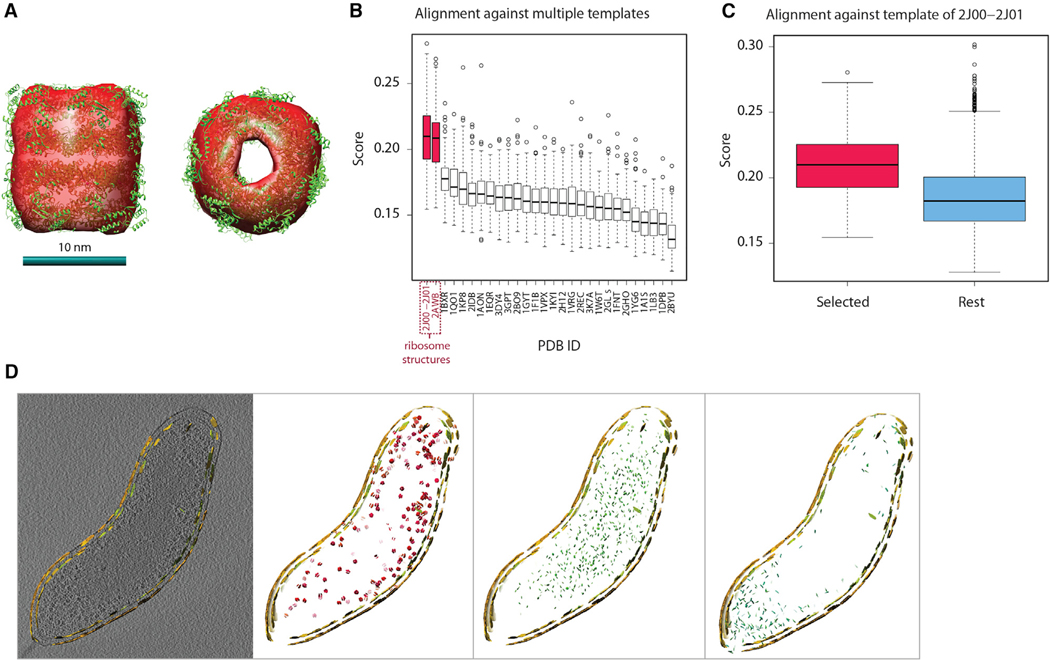
Figure 5. Analysis of Tomograms.
(A) The isosurface of the subtomogram average density map of pattern 4 from A. longum, fitted with the known structure of the GroEL (PDB: 1KP8).
(B) Assessment of pattern 1 detected in tomogram of B. bacteriovorus cell. Box plot of the distribution of alignment scores of the subtomograms of pattern 1 against all different template complexes (denoted by PDB code). The complexes are ordered according to median score in descending order. One-sided Wilcoxon rank-sum test with p-value < 1.7 × 10⁻²⁴.
(C) (Red) box plot of the alignment score distribution of subtomograms in pattern 1 (B. bacteriovorus) against the ribosome template complex (PDB: 2J00–2J01). (Blue) box plot of the alignment score distribution of all other extracted subtomograms against the ribosome template. One-sided Wilcoxon rank-sum test with p-value < 6.3 × 10⁻⁶.
(D) A thin section of embedded instances of different patterns, outlined by embedded instances of membrane patterns from tomogram of B. bacteriovorus cell. Left panel: a slice of tomogram. Shown are all membrane patterns in yellow. Second panel from left: patterns 0, 1, 9 containing ribosome structures. Third panel from left): pattern 6. Fourth panel from left: patterns 4 and 5. For analysis of patterns from tomograms of A. longum and H. gracilis, see Figure S3.

