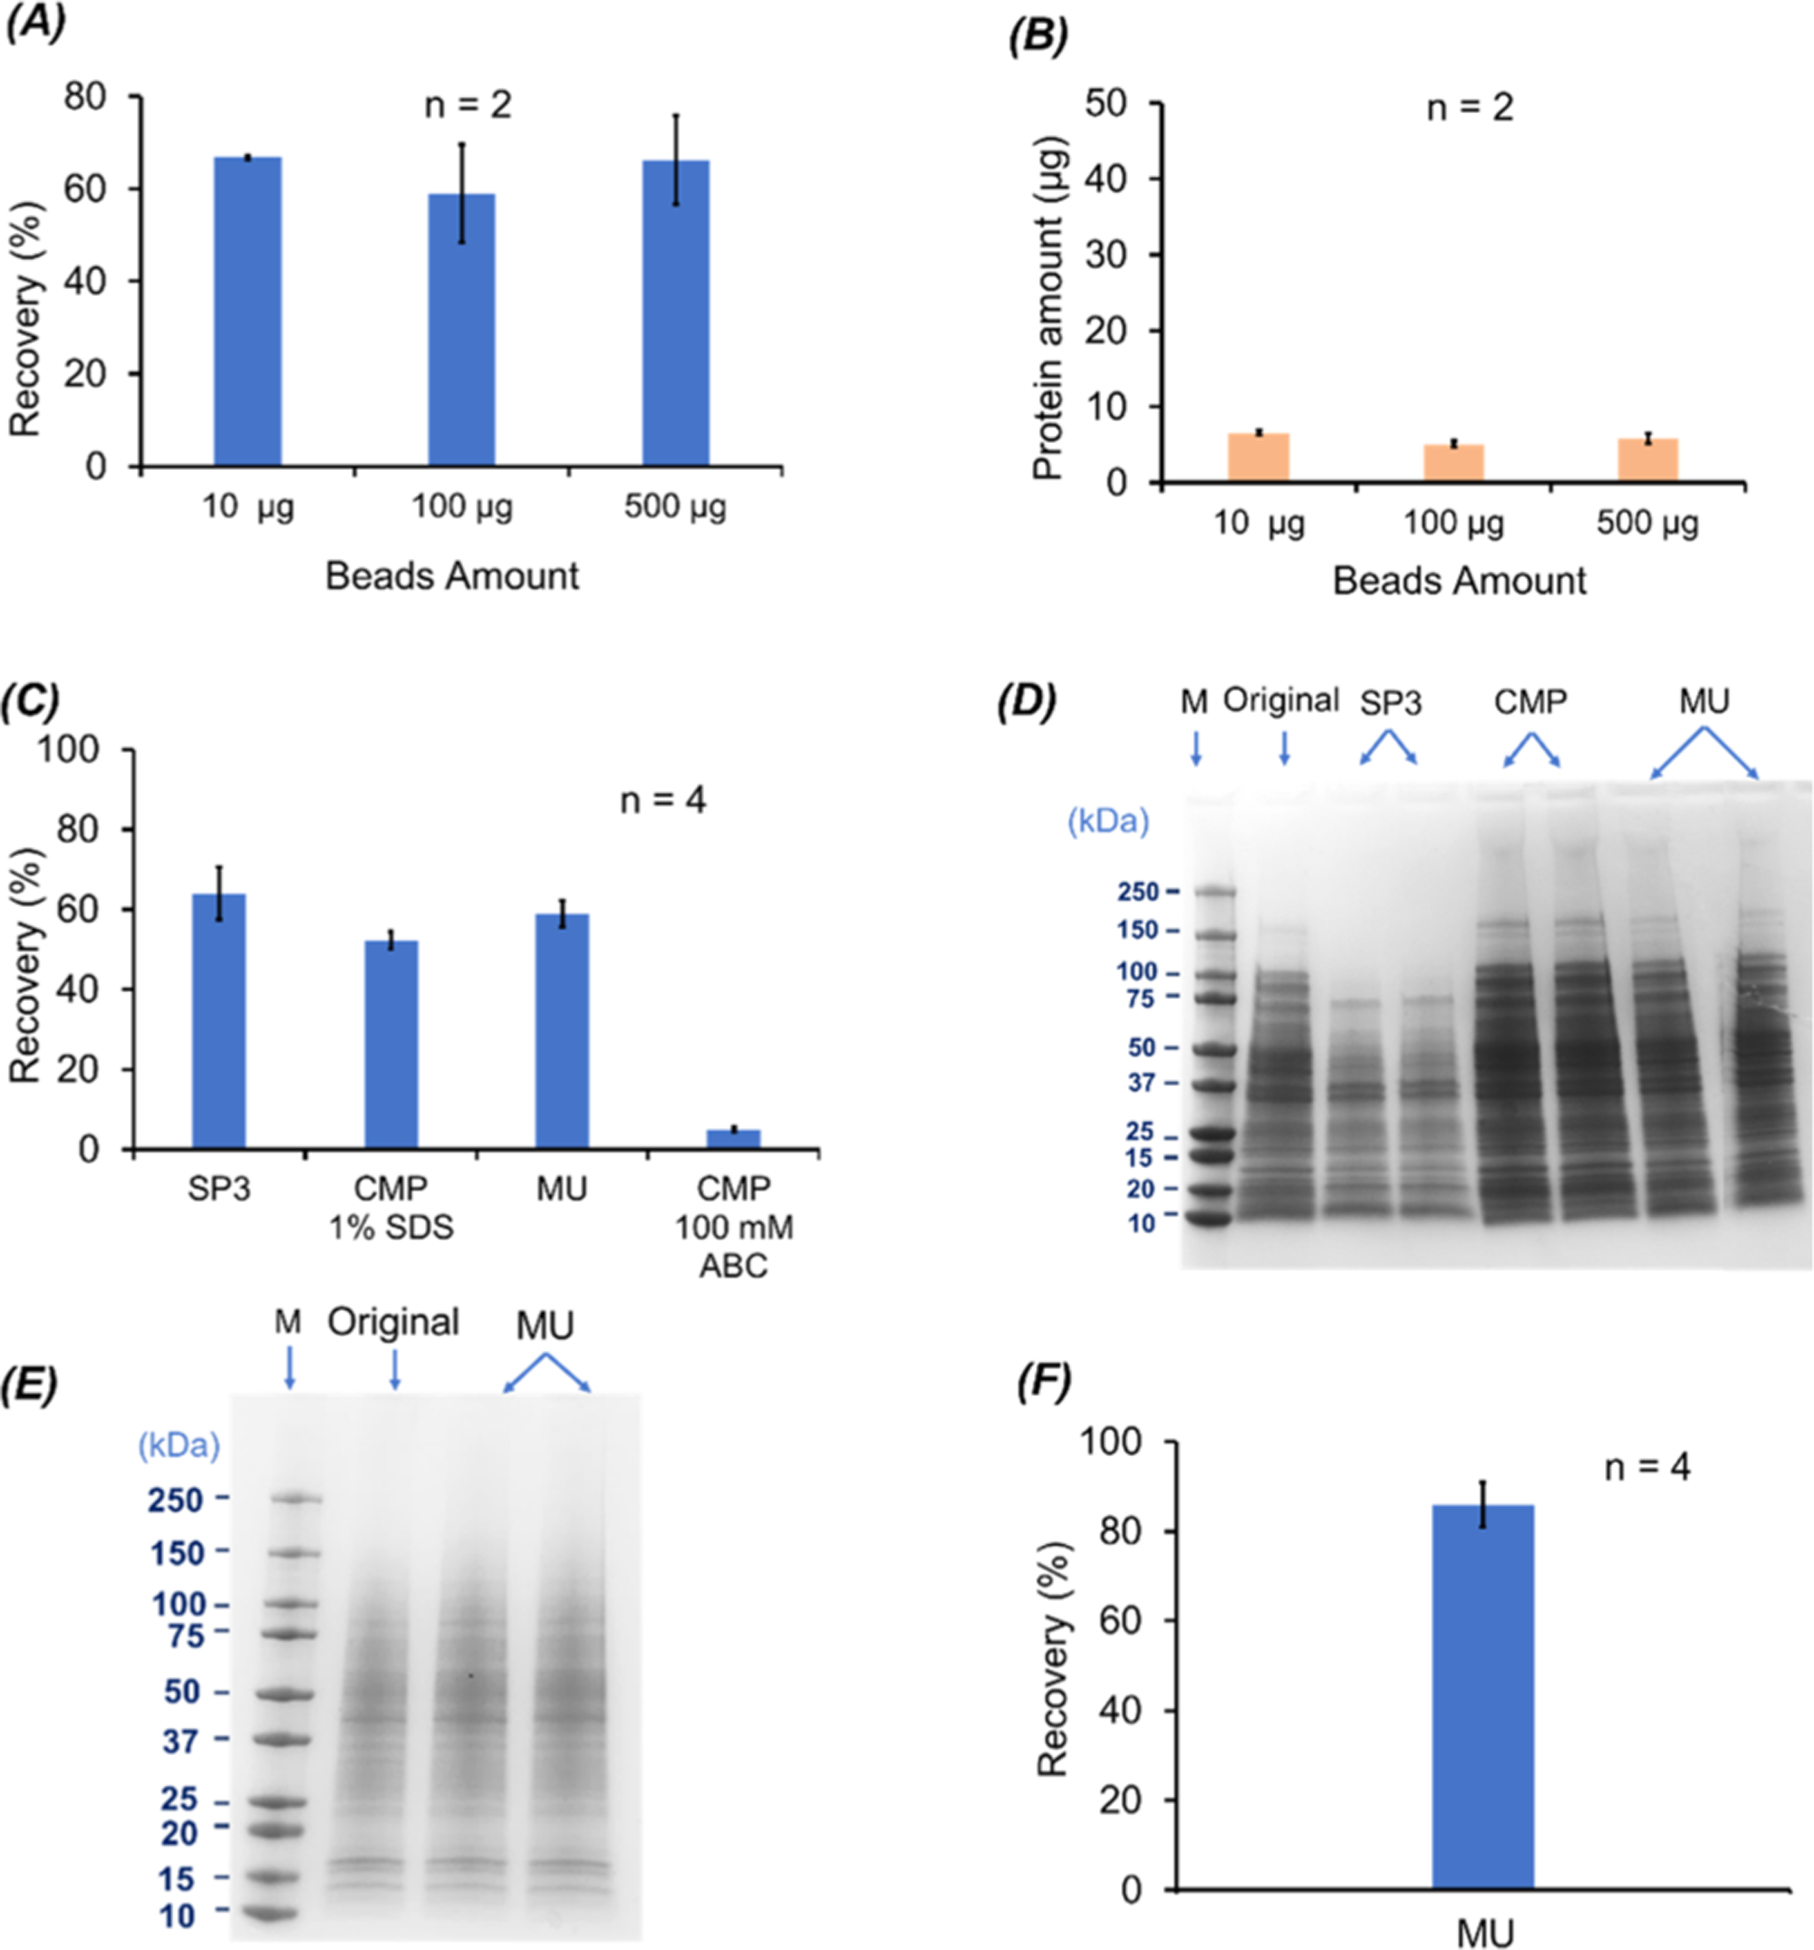
Figure 1.

BCA and SDS-PAGE results on the (A–D) E. coli cell proteins and (E, F) HepG2 cell proteins when different SDS removal methods were applied. (A) Protein recovery (%) of the SP3 method for 100 μg of E. coli proteins when different amounts of magnetic beads were used (n = 2). (B) Amounts of unbound proteins to magnetic beads as a function of the magnetic bead amount (n = 2). (C) Protein recovery (%) of the SP3, CMP, and MU methods. The protein pellets from the CMP method were dissolved in 100 mM NH4HCO3 (ABC is short for ammonium bicarbonate) (pH 8) with or without 1% (w/v) SDS (n = 4). (D) SDS-PAGE data of the recovered E. coli proteins using the SP3, CMP, and MU methods (n = 2) as well as the E. coli cell lysate in 1% (w/v) SDS before sample cleanup (original). For the CMP method, the protein pellet dissolved in 100 mM NH4HCO3 (pH 8) with 1% (w/v) SDS was used for the analysis. For each sample, an aliquot of 10 μg of proteins was loaded for SDS-PAGE. (E) SDS-PAGE data of the HepG2 cell protein samples before (original) and after sample cleanup with the MU method (n = 2). For each sample, an aliquot of 6 μg of proteins was loaded for SDS-PAGE. (F) Protein recovery data of the HepG2 cell samples after the MU method-based sample cleanup (n = 4). The error bars in the figures represent the standard deviations of protein recovery or protein amount.
