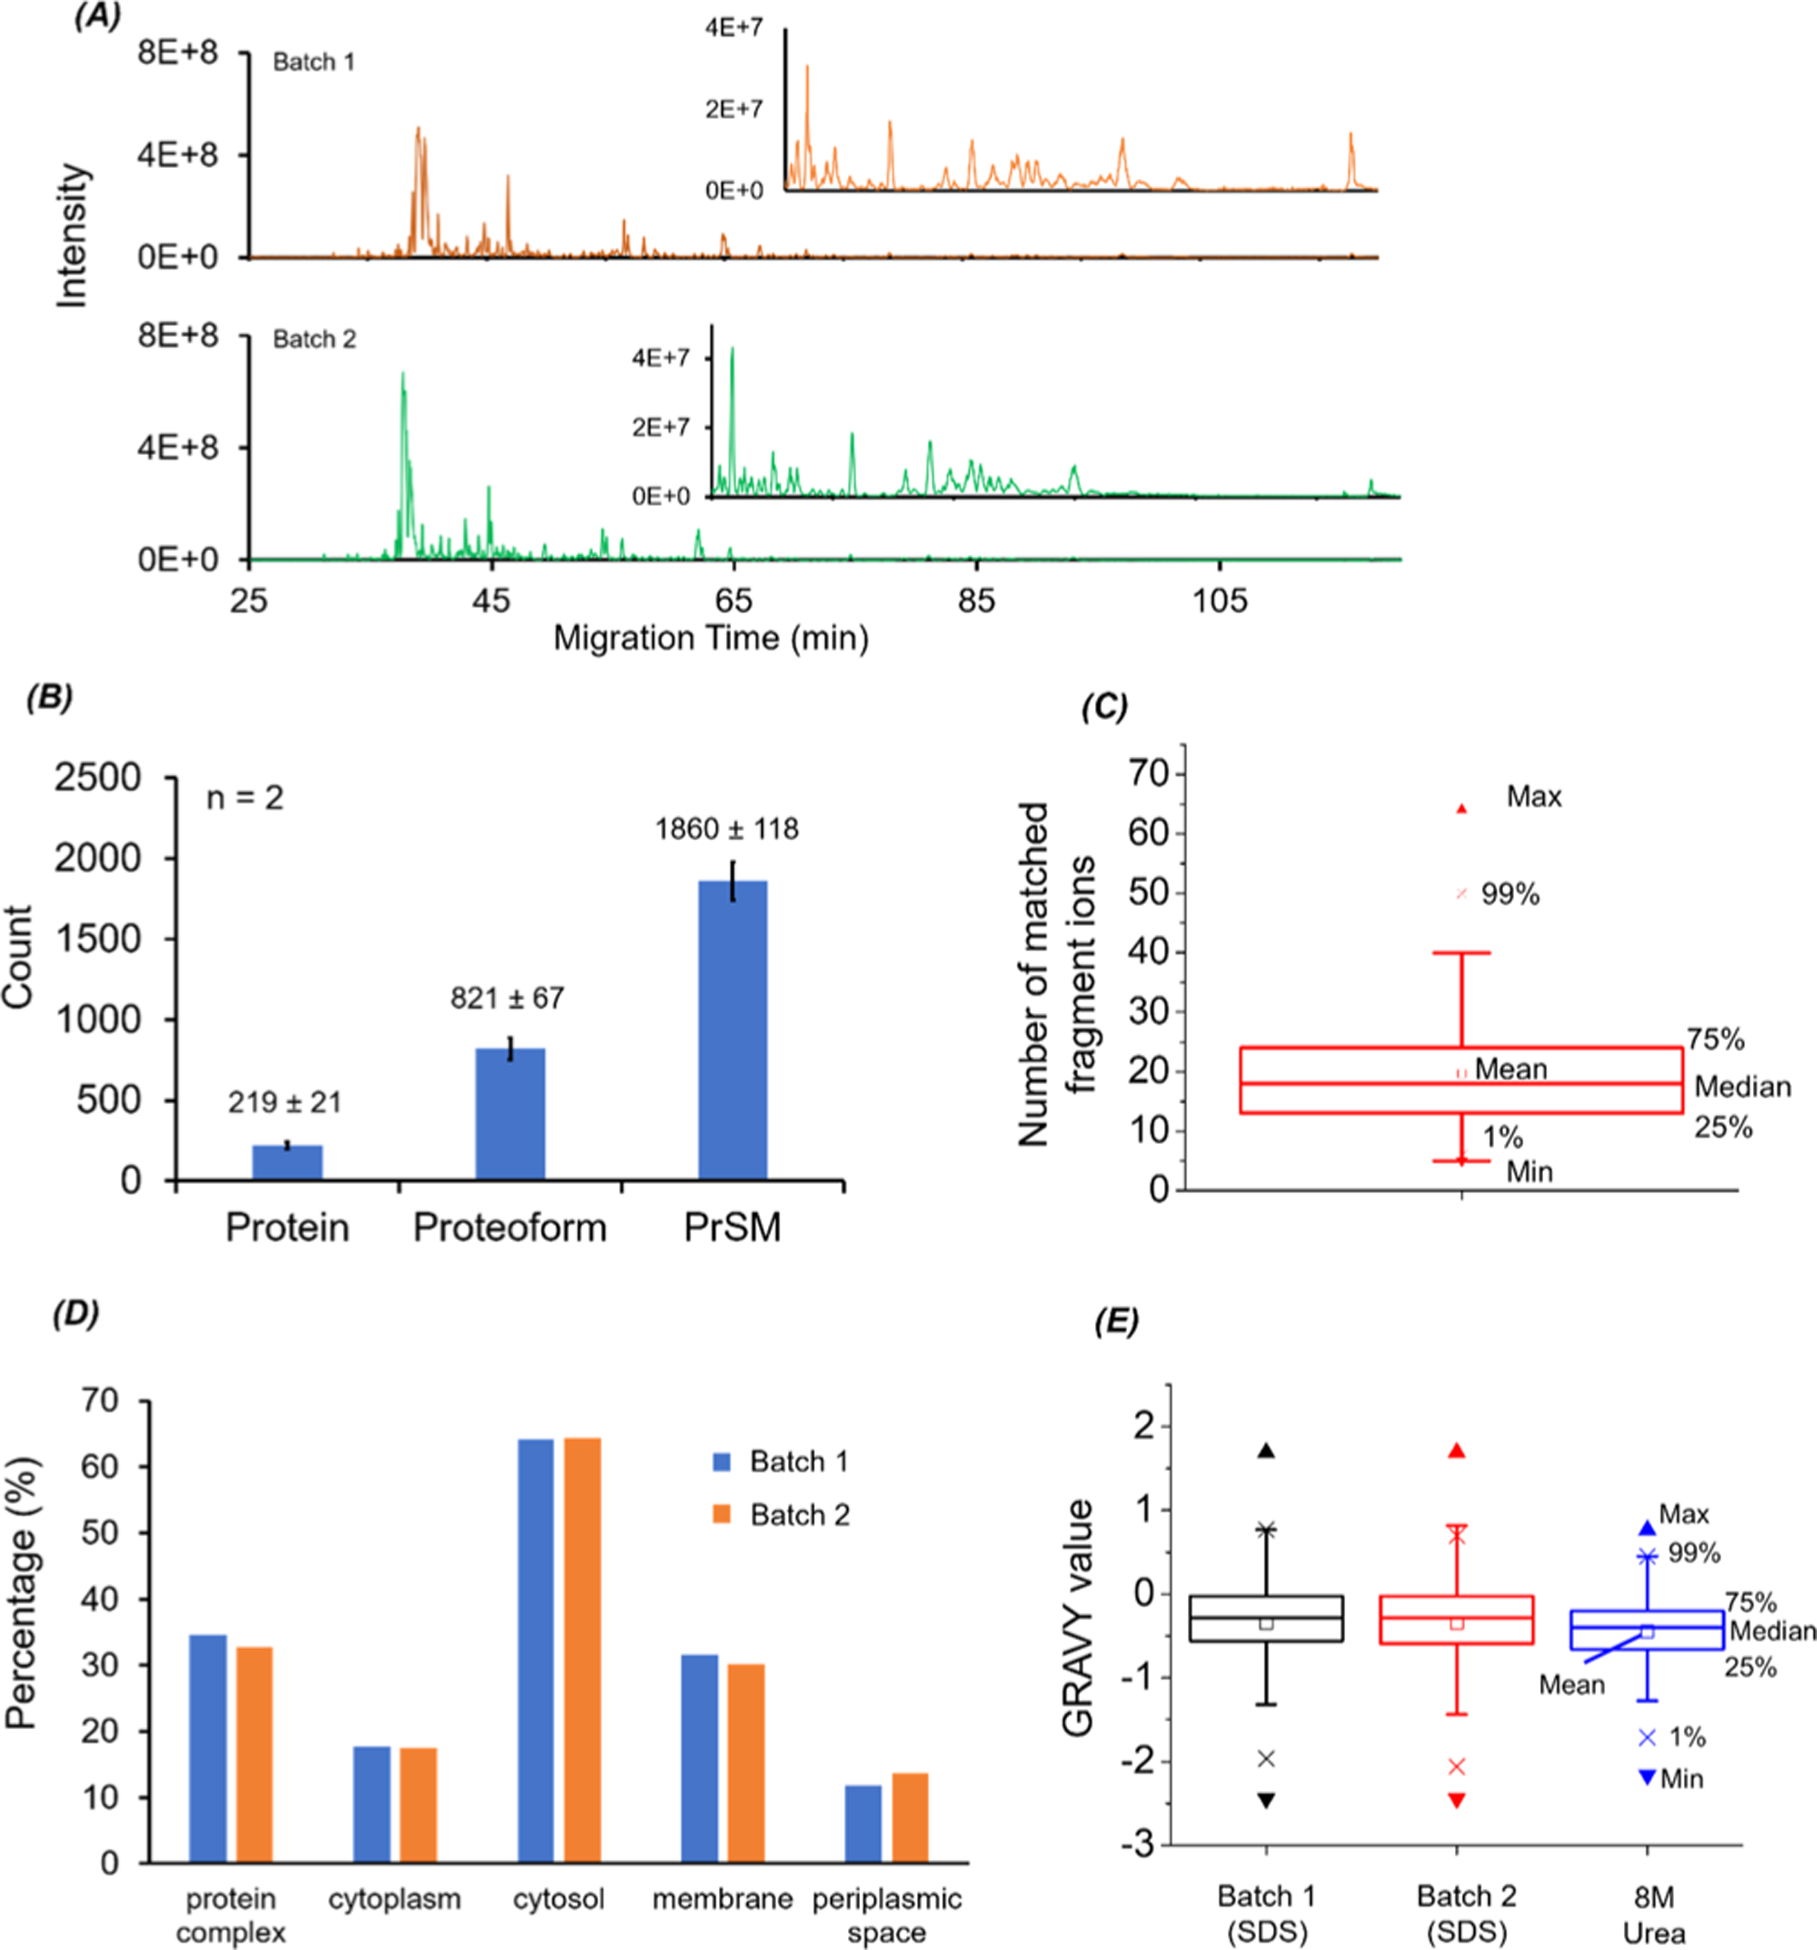
Figure 2.

CZE-MS/MS data of E. coli samples prepared with the MU method. (A) Base peak electropherograms of two batches of prepared E. coli protein samples after CZE-MS/MS analysis. (B) Numbers of proteins, proteoforms, and PrSM identifications from the two CZE-MS/MS runs. The error bars represent the standard deviations of the number of identifications. (C) Box chart of the number of matched fragment ions of identified E. coli proteoforms. (D) Gene Ontology cellular component analysis of identified E. coli proteins from the two CZE-MS/MS analyses. (E) Box charts of GRAVY values of the identified proteoforms from the two CZE-MS/MS analyses in this work (SDS-batch 1 and SDS-batch 2) and from our previous work in ref 41 (8 M urea).
