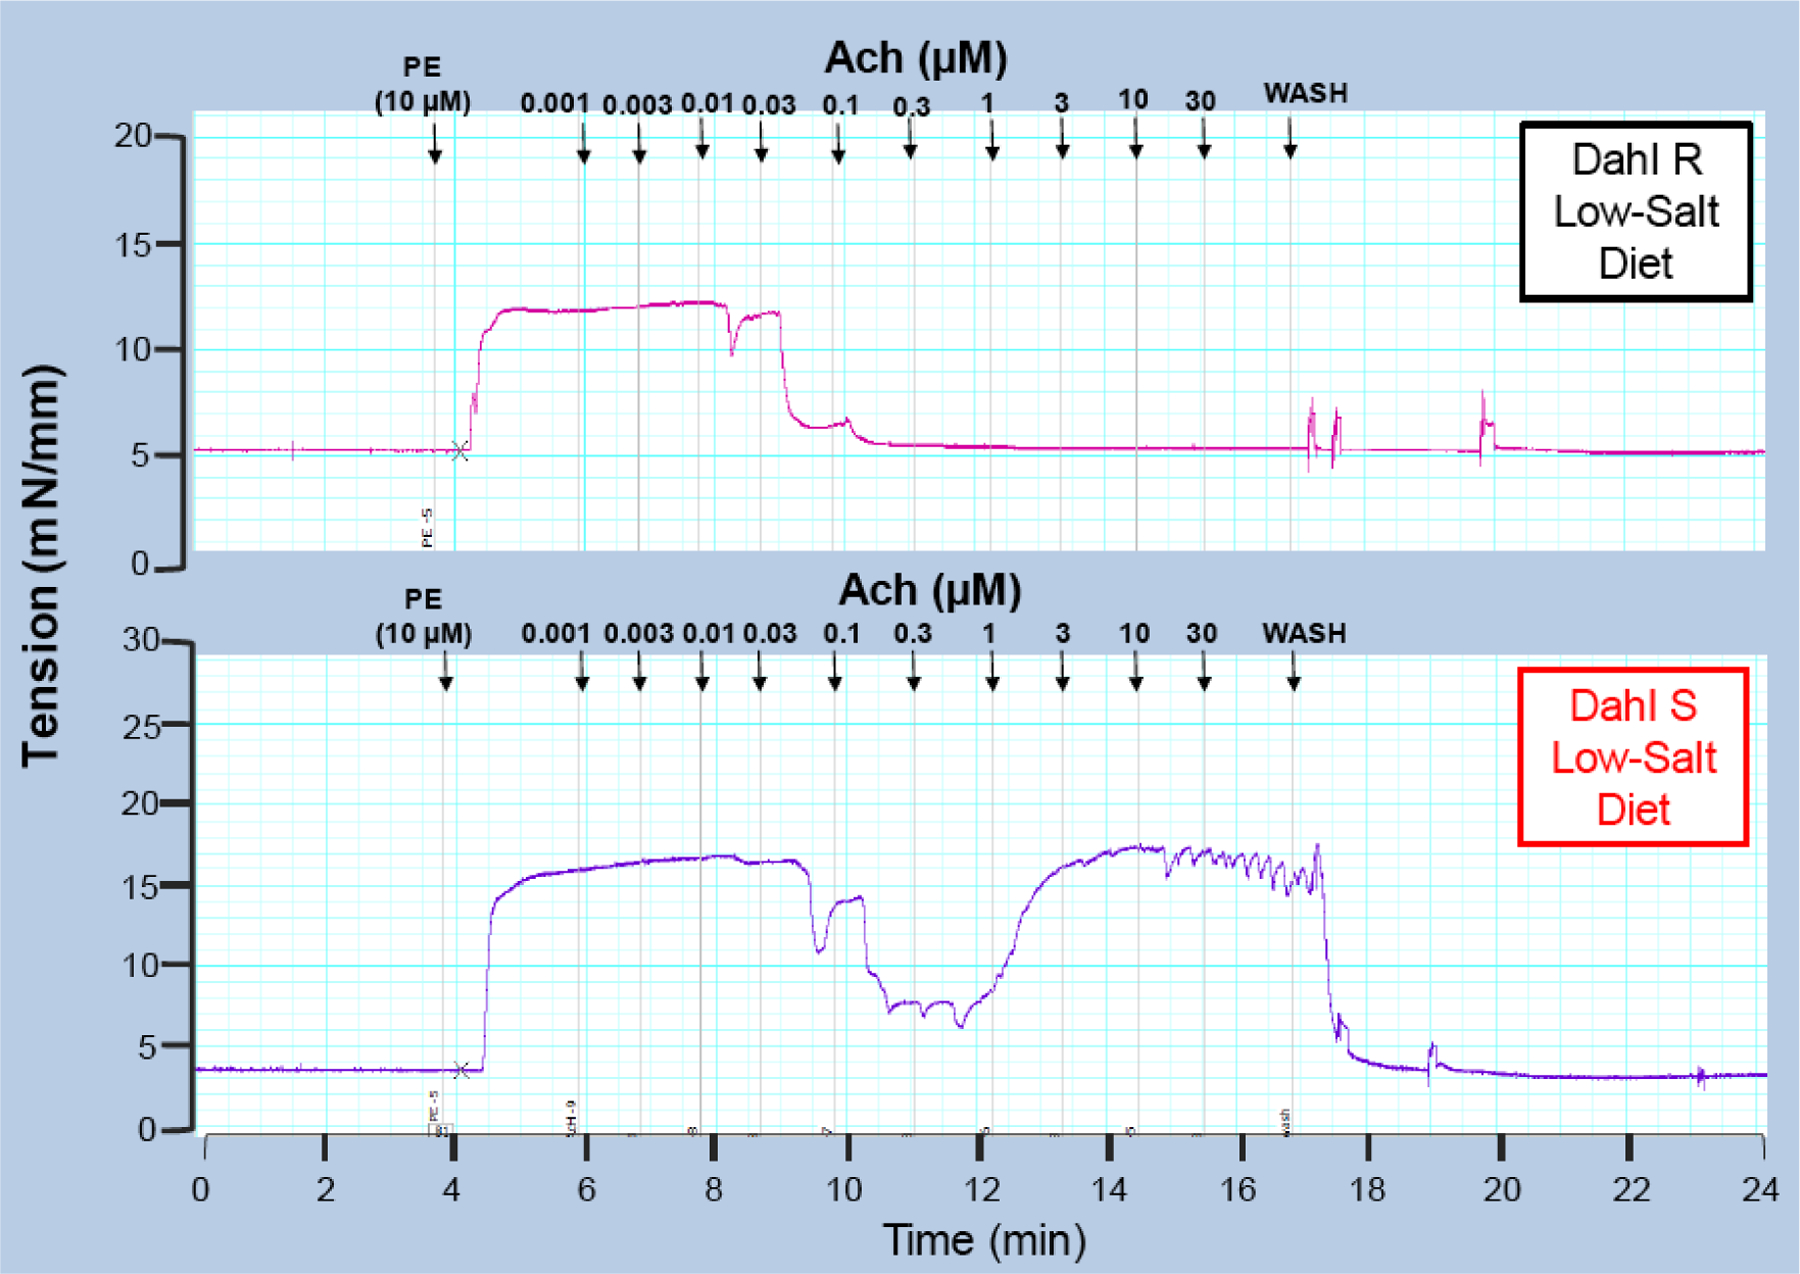
Fig. (2).

Typical traces represent concentration response curve to acetycholine (1nM −30 μM) in mesenteric resistance arteries from 8-weeks old Dahl salt (S) sensitive and resistant (R) rats fed a 0.3% low-salt diet. The arteries were initially contracted with phenylephrine (10 μM). This is a representative illustration of traces observed in our laboratory. However, similar findings are quantified in multiple studies [13–15, 35–37].
