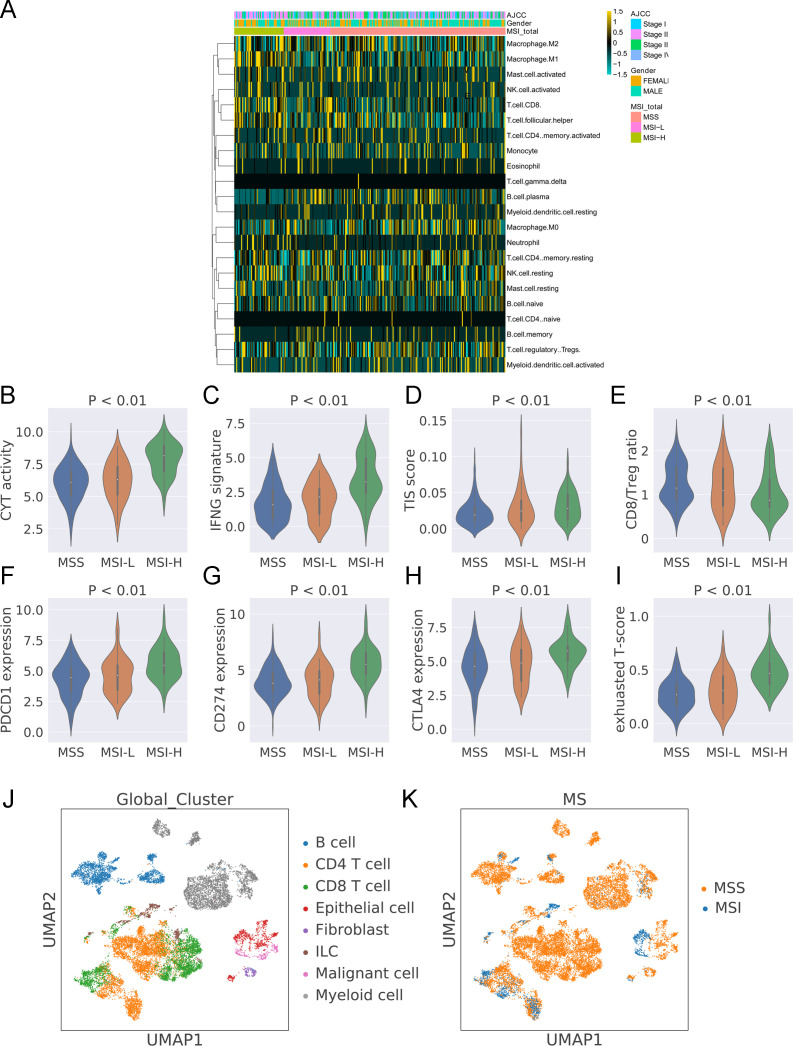
Figure 1.
Estimation of immune cell populations and immune signatures in TCGA-colon cancer. (A) Heatmap showing the estimation of immune cell populations in the TCGA-colon cancer cohort. (B) The ratio of immune cell populations and microsatellite status. The CYT activity (C), IFNG expression (D), TIS score (E), and CD8:Treg ratio (F) in colon cancer with MSS, MSI-L, and MSI-H. The CD274 (G), PDCD1 (H), and CTLA4 (I) expression and exhausted score (J) in colon cancer with MSS, MSI-L, and MSI-H. (K) UMAP clustering of tumor microenvironment cell populations with information regarding cell types from GSE146771. (L) UMAP clustering of tumor microenvironment cell populations with information regarding microsatellite status from GSE146771.

