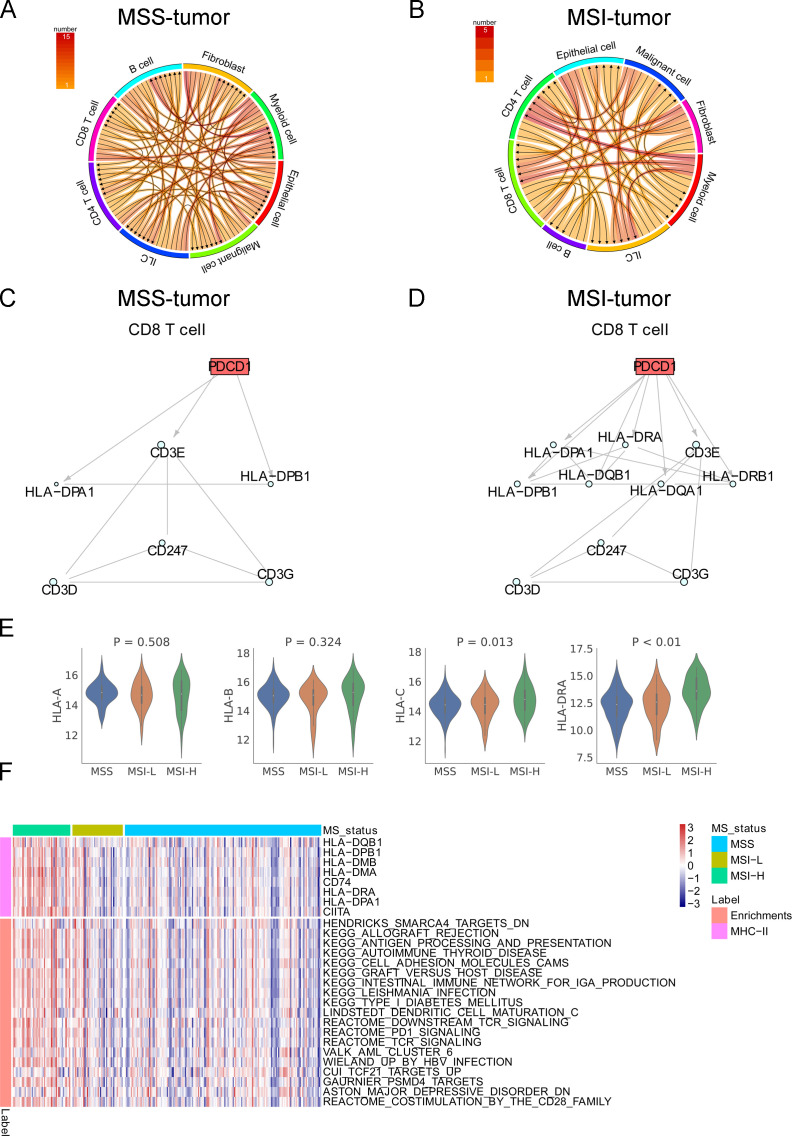
Figure 3.
CCIs in colon cancer with MSS and MSI. The directions and number of ligand–receptor interactions in MSS (A) and MSI (B) tumors in GSE146771. The intracellular network of PD1 in CD8+ T cells in MSS (C) and MSI (D) tumors. (E) The expression level of MHC-I molecules and MHC-II molecules (HLA-DRA) in MSI and MSS colon cancer in the TCGA colon cancer cohort. (F) The TCGA colon cancer transcriptome data were analyzed using the curated Molecular Signatures Database.

