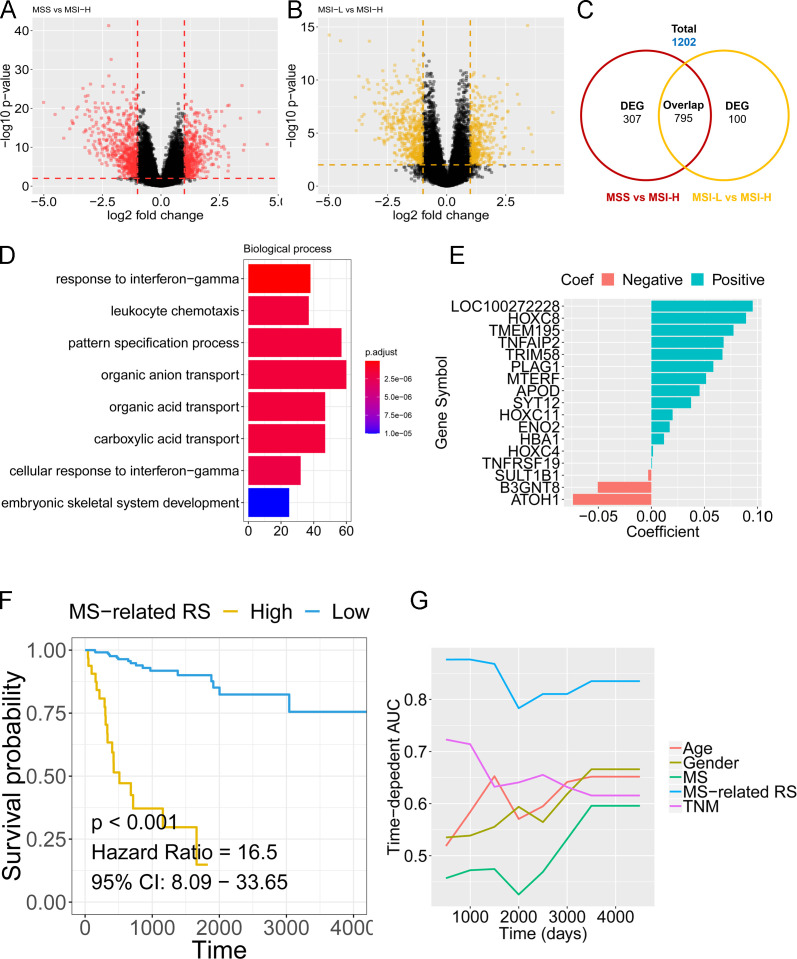
Figure 6.
Construction of a microsatellite status–related gene signature by TCGA colon cancer dataset. (A) The volcano plot shows the DEGs between MSS and MSI-H. (B) The volcano plot shows the DEGs between MSI-L and MSI-H. (C) The Venn plot shows the total genes and overlapping genes from the volcano plots. (D) Gene ontology analysis by the total genes from the Venn plot. (E) The coefficient calculated by LASSO Cox regression. (F) Kaplan-Meier analysis showed that patients with colon cancer with a higher MSRS exhibited an unfavorable CSS in the TCGA cohort. (G) tROC analysis indicated a higher prediction efficacy of the MSRS than other clinicopathological traits.

