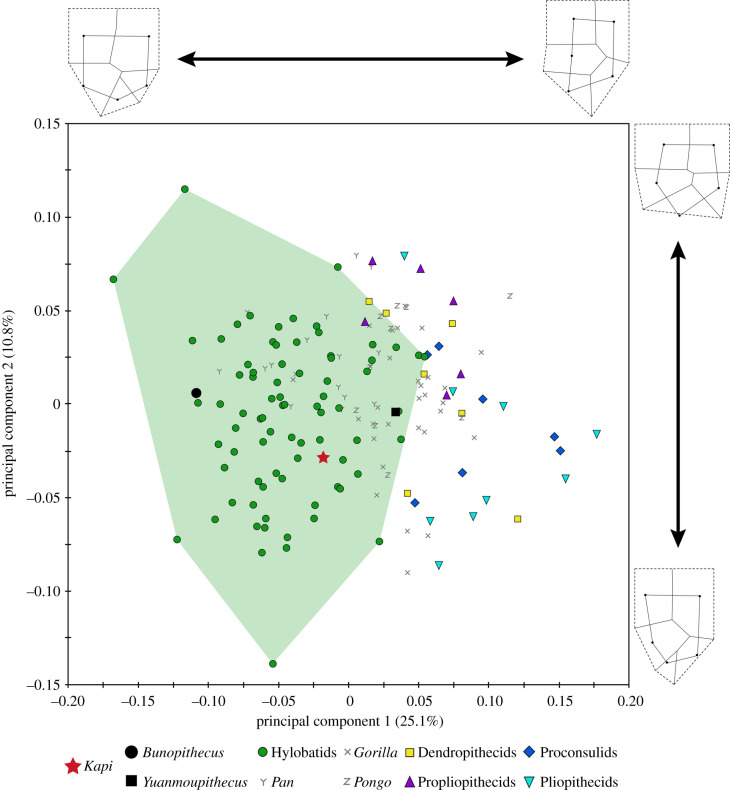
Figure 3.
PCA resulting from two-dimensional morphometric analysis of overall M3 crown shape characterized by 14 homologous landmarks (see wireframes; cusps = black circles). Kapi plots comfortably within hylobatid space (=green polygon), and completely outside the sampled distribution of stem catarrhine and stem hominoid taxa. By contrast, Yuanmoupithecus plots within the small area of overlap between stem and crown catarrhine/hominoid taxa, including crown hylobatids. (Online version in colour.)

