Figure 2.
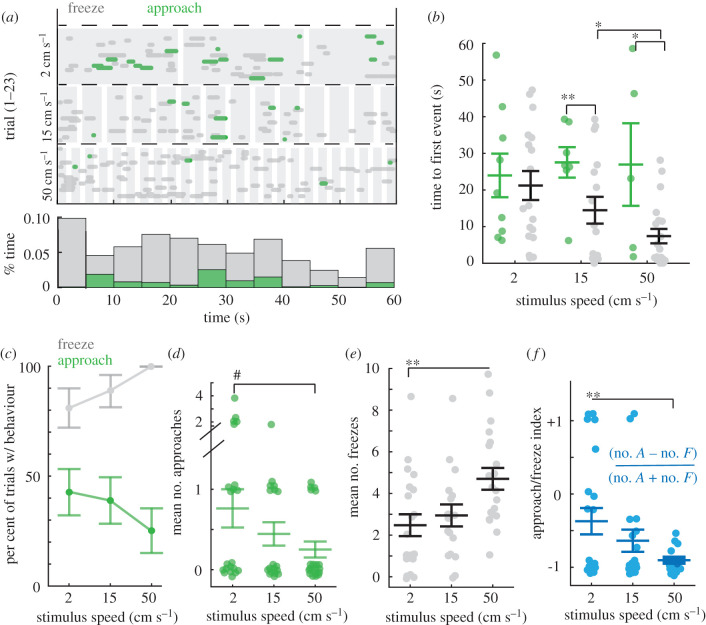
Mice freeze or approach when presented with novel, small, moving stimuli. (a) Top, an ethogram representing when approach or freezing occurred relative to stimulus presentation (shaded in grey) of three different speeds of the stimulus. The responses observed in each trial (separate mouse) is denoted by a separate line in the ethogram. Green = approach, grey = freeze. Horizontal dashed line separates trial types based on stimulus speed, n = 23 mice. Bottom histogram, the proportion of time spent engaged in each type of response during each 5 s segment of the 60 s trial, collapsed across all speeds. (b) Mean time to the first orienting response of each type (green = approach or grey = freeze) for mice that display at least one type (two-way ANOVA, F = 9.1957, p < 0.001, Tukey's post hoc, * = p < 0.05 and ** = p < 0.01, n for each speed = 9, 7, 5 mice and 17, 16, 20 mice approach versus freeze, respectively). (c) Percentage of trials with at least one freeze (grey) or approach (green) by stimulus speed. Percentage of trials with freezes is significantly higher than that with approaches for each stimulus speed (Fisher's exact tests, p < 0.05, p < 0.01 and p < 0.0001, respectively). Error bars are standard deviation. (d) Number of approaches per mouse (one-way ANOVA, (F2 = 2.8418, p = 0.07, # = nearly significant). All conditions had significantly more approaches than a mean of 0 (Student's t-tests, p < 0.001, p < 0.01 and p < 0.05). (e) Number of freezes per mouse (one-way ANOVA, (F2 = 6.54, p < 0.01, Tukey's post hoc, ** = p < 0.01). Freezing evoked by all stimuli were highly significantly greater than a mean of 0 (Student's t-tests, p < 0.0001 in all cases). (f) Approach-to-freeze index by stimulus speed (one-way ANOVA, (F2 = 5.97, p < 0.01, Tukey's post hoc, ** = p < 0.01). Error bars are ± SEM unless noted otherwise. (Online version in colour.)

