Figure 3.

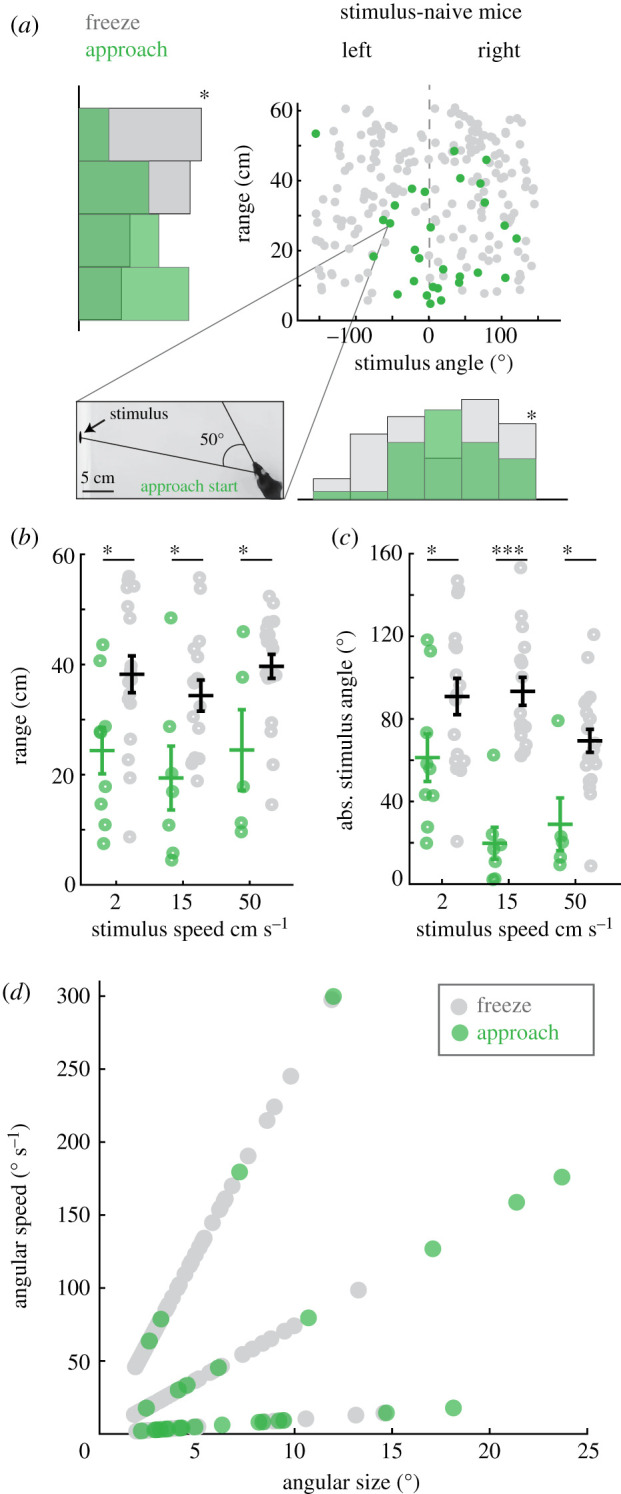
Freeze and approach orienting responses in naive mice are evoked by distinct combinations of stimulus size, speed, and location in the visual field. (a) Distribution of mouse ranges (cm) and stimulus angles (deg) relative to the mouse's head, where freezes occur (grey) or approaches start (green). * = p < 0.05, Kolmogorov-Smirnov (KS) test on range distributions, * = Ashman's D > 2 for distribution of stimulus angles at freeze starts. Plots show all individual behavioural events for all 23 mice, n = 29 and 199 approach starts and freezes, respectively. Inset, representative frame from a video where the highlighted data point is measured. The frame is annotated to show the stimulus angle relative to the mouse's head when that particular approach started. (b) Mean trial-averaged range at all three speeds. Each speed condition is represented as a separate category on the x-axis, approach and freeze data are also separated along the x-axis by a fixed amount and then jittered in the ×dimension to improve visualization of each distribution where approaches start (green circles) or freezing occurs (grey circles) (two-way ANOVA, (F1 = 19.99, p < 0.0001, Tukey's post hoc, * = p < 0.05, n = 9, 7, 5 mice and 17, 16, 20 mice for each stimulus speed, approaches or freezes, respectively). (c) Mean trial-averaged absolute stimulus angles relative to the mouse at approach starts or freezes (two-way ANOVA, (F2 = 3.17, p < 0.05, Tukey's post hoc, * = p < 0.05, *** = p < 0.0001). (d) Angular size versus angular speed of stimuli at approach start (green) or freeze (grey) reveals angular size and speed preferences for each behaviour. (Online version in colour.)
