Figure 2.
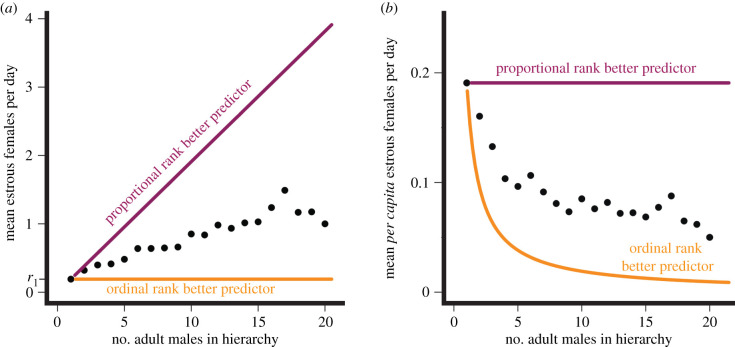
(a) The theoretical and empirical relationships between male hierarchy size (x-axis) and resource availability (y-axis) using the example of oestrous female baboons, a resource over which male baboons compete for mating success. The orange line shows a theoretical scenario in which the number of oestrous females in the group (total resource base) is constant as the number of males in the hierarchy increases; in this case, male mating success (the resulting measured trait) would be predicted by simple ordinal rank. The purple line shows a scenario in which the number of oestrous females increases in proportion to the number of males in the hierarchy; in this case, male mating success would be predicted by proportional rank. The slope of the orange line is 0 and the intercept is r1, which designates the quantity of resources available in a hierarchy size of 1 male (r1 = 0.2 oestrous females in this figure). This value, r1, determines the slope of the purple line; i.e. for proportional rank to perfectly predict mating success, resource availability must increase by r1, the quantity available to the first male, as each male is added to the hierarchy. The empirical relationship between male hierarchy size and the number of oestrous females (Amboseli baboon data; black points) is positive, but the slope is closer to the orange line than the purple line. Thus, we expect simple ordinal rank to best predict mating success. (b) Similar to (a), but the number of oestrous females is plotted per capita (i.e. per adult male in the hierarchy). The orange curve illustrates the case in which the resource stays constant across different hierarchy sizes; thus, average per capita resource access declines as hierarchy size increases. The purple line illustrates the case in which the resource base increases proportionately with hierarchy size; thus, average per capita resource access is fixed. The black points represent the same empirical data as in (a). Note that the framework above assumes that any given individual's ability to maintain control of a resource is independent of group size. (Online version in colour.)

