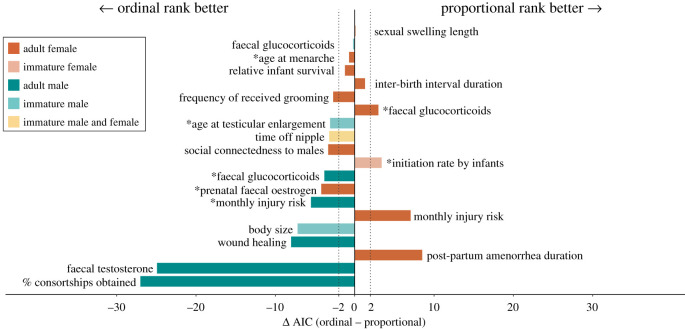
Figure 3.
Visualization of model outcomes when predicting the same trait with simple ordinal rank (labelled ‘ordinal rank’) versus proportional rank. Each bar corresponds to a trait, and its value corresponds to a difference in AIC scores between models that used simple ordinal versus proportional rank. Vertical dashed lines represent |ΔAIC| = 2. For traits whose bars are within the dashed lines, neither rank metric performed substantially better than the other (5/20 analyses; we did not find any indication that the ability of the models to differentiate between the predictive power of simple ordinal versus proportional rank depended on the duration of the study; p = 0.9, Pearson's product moment correlation). For traits whose bars are to the left of the dashed lines, simple ordinal rank was a better predictor of the trait than proportional rank (11/20), and vice versa for traits whose bars are to the right of the dashed lines (4/20). Colours of bars indicate sex (male, female and both), and shading indicates age class (adult or maternal rank of immatures). Asterisks indicate the seven traits for which only one rank metric predicted the trait better than the null model. The top two bars, sexual swelling length and faecal glucocorticoids, were traits measured in adult females and immature males, respectively. See electronic supplementary material, table S1 for information about the originally identified rank effects. (Online version in colour.)

