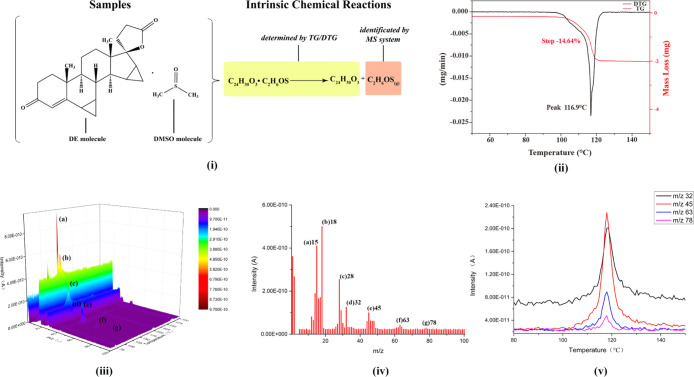
Figure 2.
Mechanism of TG–MS analysis for the solvatomorph of DE (i); TG and DTG curves of crystal form C (ii); mass spectrum of the evolved gases at 115.4 °C (iii); characteristic fingerprint of the mass spectrum of evolved gases from crystal form C (iv); mass ion curves of the four main characteristic fragment ions of DMSO (v).

