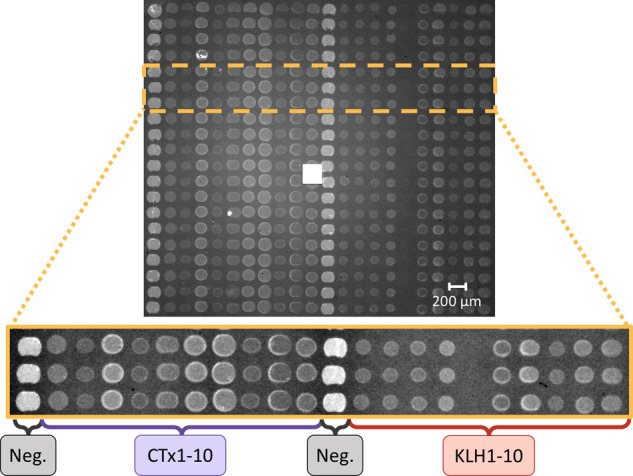
Figure 3.

IRIS image of the 440 antibody spots on one of the chips used for the experiments. The first and 12th columns are devoted to the control (bovine IgG), columns 2–11 are devoted to fumonisin B1-CTxB antibodies (CTx1-10), and columns 13–22 are devoted to fumonisin B1-KLH antibodies (KLH1-10). The different intensity of the spots is due to differences in concentration of the spotted samples.
