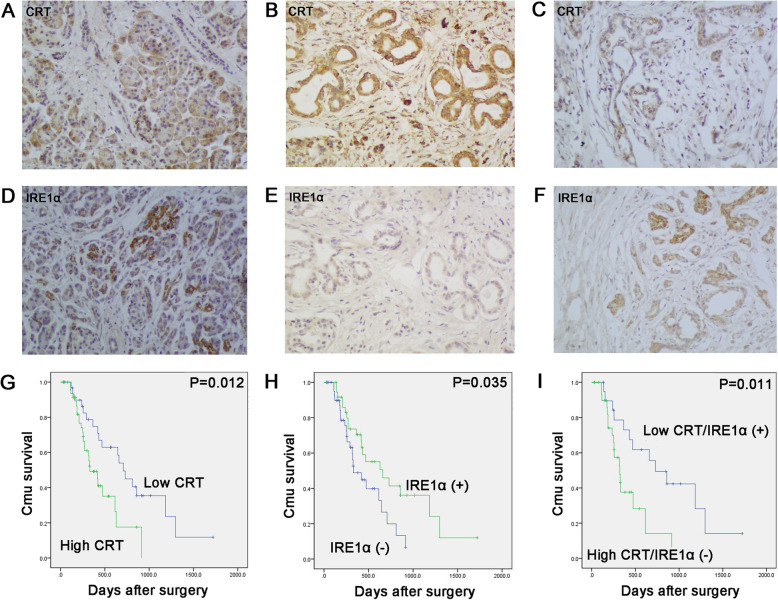
Fig. 8.
The negative relationship of CRT and IRE1α expression in human PC samples was coordinately associated with the survival of PC patients. a, d Low CRT (a) and positive IRE1α (d) expression in normal pancreas. b, e High CRT (b) and negative IRE1α (e) expression in one serial PC sample. c, f Low CRT (c) and positive IRE1α (f) expression in another serial PC sample. g Kaplan–Meier curves for patients with high versus low CRT expression in tumors. h Kaplan–Meier curves for patients with positive (+) versus negative (−) IRE1α expression in tumors. I Kaplan–Meier curves for patients with the co-expression of CRT and IRE1α

