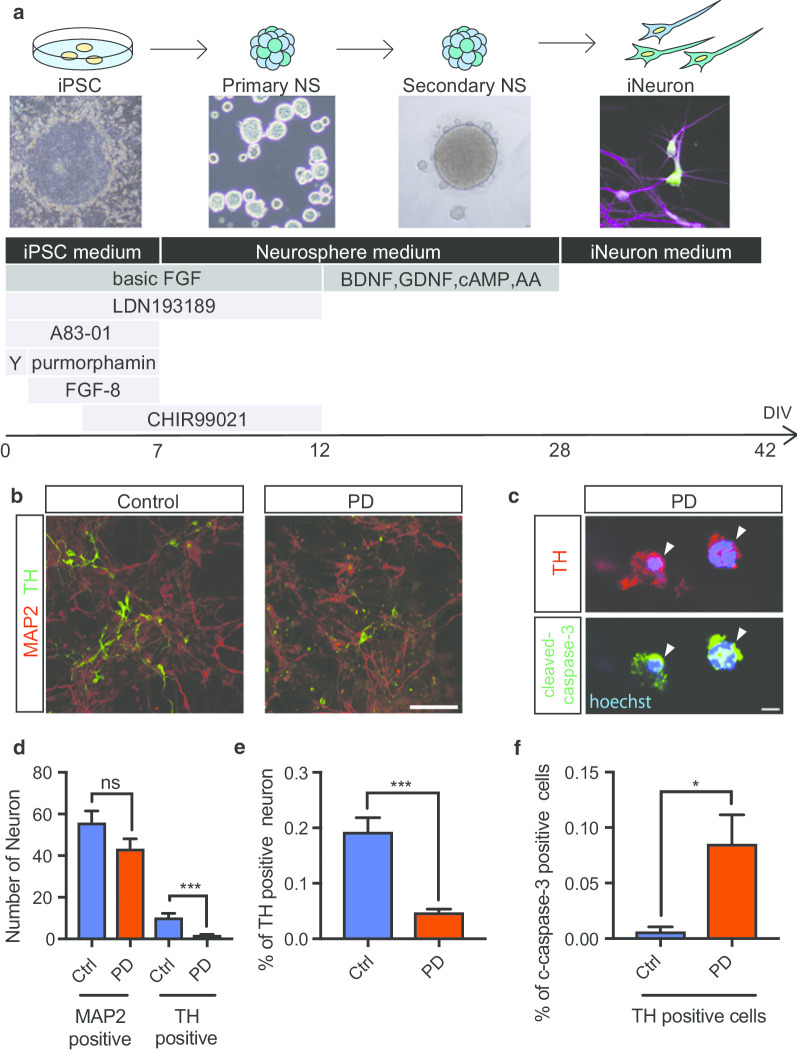
Fig. 1.
Differentiation and Characterization of iPSC-derived Dopaminergic (DA) Neurons. a Schematic overview of the conditions used to differentiate iPSCs into DA neurons, with bright-field representations of the cells at several stages of differentiation shown. b Immunostaining of differentiated DA neurons at 42 DIV. The neuronal marker MAP2 (red) and the DA neuron marker TH (green) are shown in the control and PD groups. c Immunostaining of apoptotic DA neurons (arrow heads) using markers of apoptosis (cleaved caspase-3) and DA neurons (TH). DA neurons were positive for both cleaved caspase-3 and TH. d, e Quantitative analysis of the number in a single field and percent of DA neurons among iPSC-derived neurons (iNeurons). The number and percent of TH-positive cells were lower in the PD group than in the control group (1.0 = 100%, n = 5 in control group, n = 5 in the PD group). f Quantitative analysis of the percent of apoptotic DA neurons among iNeurons. The percent of apoptotic cells was higher in the PD group than in the control group (1.0 = 100%, n = 3 in the control group, n = 3 in the PD group). Data are represented as mean ± SEM; n.s., not significant. *P < 0.05, ***P < 0.001; Mann–Whitney U-test in d–f. Scale bars, 100 μm in b and 5 μm in c. See also Additional file 1: Table S1, Additional file 2: Figure S1 and Additional file 3: Figure S2

