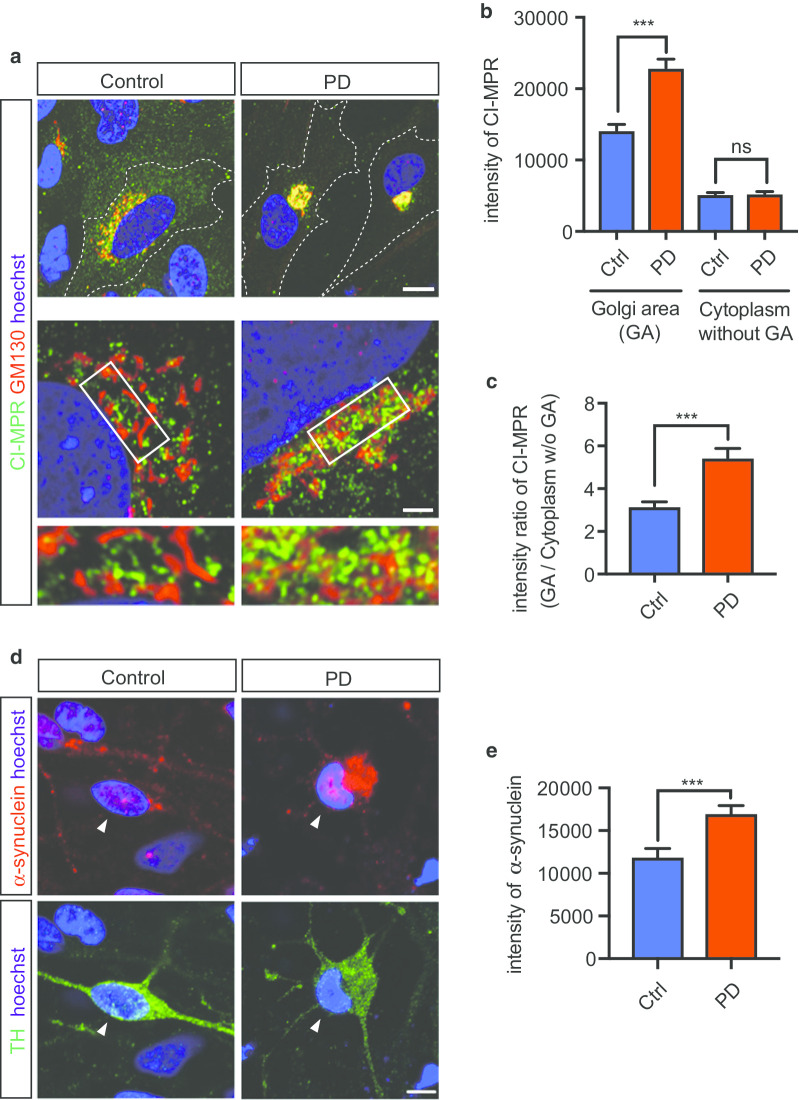
Fig. 6.
Distribution of CI-MPR in Glial Cells Derived from iPSCs. a Immunostaining of glial cells for CI-MPR and the Golgi. A proportion of CI-MPR was localized to the perinucleus around the Golgi (Golgi area) in the control group. In the PD group, CI-MPR appeared to accumulate around the Golgi. b Quantification of the results of localization analysis performed in a. The figure shows the intensity of CI-MPR in the cytoplasm (without Golgi area) and Golgi area (n = 3 per line, total n = 69 cells in each group). c Quantification of the results of localization analysis performed in a using the ratio of intensities in the Golgi/cytoplasm (without Golgi) (n = 3 per line, total n = 69 cells in each group). d Immunostaining of iPSC-derived DA neurons (arrow heads) for α-synuclein and TH. e Quantification of the intensity of α-synuclein in the cytoplasm in iPSC-derived DA neurons. The intensity of α-synuclein in the cytoplasm was higher in the PD group than in the control group. (n = 3 per line, total n = 45 cells in Control, n = 39 cells in PD). Data are represented as mean ± SEM; ***P < 0.001; Mann–Whitney U-test in b and c. Scale bars, 10 μm in the upper part of a, 2 μm in the lower part of a and 5 μm in d. See also Additional file 15: Figure S6

